Overview
Appliance Health Monitoring helps you proactively manage and troubleshoot the performance of your Login Enterprise Virtual Appliance. By monitoring key metrics, you can ensure optimal operation and resource utilization, preventing minor issues from becoming major problems.
Benefits of Appliance Health Monitoring
|
Benefit |
Explanation |
|---|---|
|
Real-time health monitoring |
Allows you to continuously monitor the health of your Appliance in real time. |
|
Early issue detection |
Helps identify and address potential problems before they escalate into major issues. |
|
Disk space visibility |
Provides clear insight into available disk space, helping prevent critical shortages. |
|
Performance impact awareness |
Enables observation of how heavy Tests affect Appliance performance. |
|
Usage trend tracking |
Tracks usage patterns over time to support better planning and analysis. |
|
Informed resource allocation |
Helps you make decisions about allocating resources based on collected data. |
Key Metrics Monitored
-
Disk utilization
-
Description: Displays the percentage of total disk space currently in use.
-
Importance: Helps you keep track of available disk space and avoid running out, which can lead to critical issues.
-
-
Disk utilization (Inodes)
-
Description: Shows the percentage of inodes used versus the total available. An inode represents a file or directory, so running out of inodes means you can’t create new files or directories even if there is free disk space.
-
Importance: Useful for managing systems with a large number of small files, preventing inode exhaustion.
-
-
CPU utilization
-
Description: Indicates the percentage of CPU resources currently in use.
-
Importance: Helps you monitor how efficiently your Appliance’s CPU is being used and identify potential performance bottlenecks.
-
-
Memory utilization
-
Description: Shows the percentage of RAM currently in use.
-
Importance: Provides insight into memory usage, helping you understand if your Appliance needs more resources or if there are inefficiencies.
-
Technical Details on Metrics Monitoring
-
Disk space and inodes check: We check for disk space and inodes every 20 minutes.
-
Disk and Memory utilization: We monitor disk and RAM utilization every 20 seconds. The results are averaged per minute, which is then displayed in the daily graph view.
Metric Gathering Methods
-
CPU metrics: We read the
/proc/statfile at a 20-second interval and calculate the delta using the algorithm in c#. For details, see Gathering CPU utilization from /proc/stat. -
Memory metrics: We gather memory metrics from /proc/meminfo, where the calculation is performed as follows:
UsedMemory = MemTotal - MemFree. -
Disk metrics: Disk usage is monitored using the
dfcommand. For details, see the df Command documentation. -
Inodes metrics: Inodes are monitored using the
dfcommand with the-ioption.
Accessing Appliance Health Monitoring
-
In the Login Enterprise sidebar menu, navigate to System > Appliance Health.
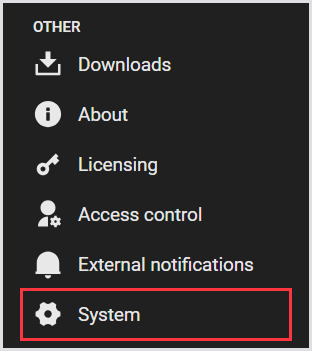
-
In System, select Appliance Health from the tab menu.

Using Appliance Health Monitoring
-
View metrics: The main screen displays the chart with 4 key metrics:
-
CPU utilization
-
Disk utilization (Inodes)
-
Disk utilization
-
Memory utilization
-
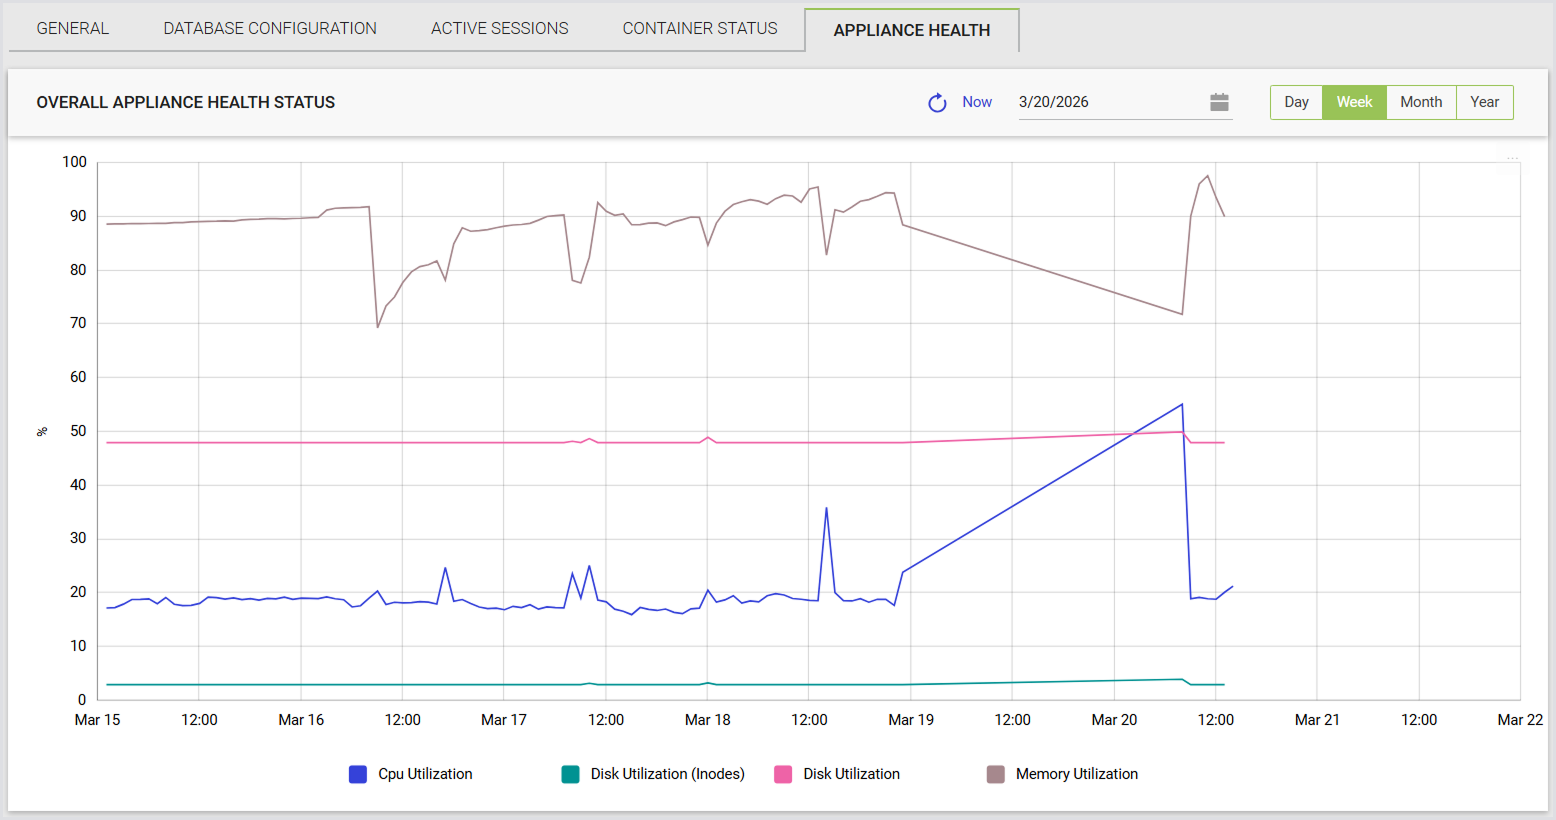
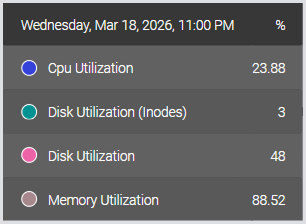
Tip: Hover over the trend to see the metric details.
-
Analyze data: Review the metrics to understand your Appliance’s current health status. Check for any unusual trends or values that might indicate potential issues.
-
Take action: Based on the data, you can take appropriate action, such as freeing up disk space, managing inode usage, or upgrading resources if necessary.
Downloading Charts as an Image
You can download charts as images for sharing or use in custom reports and presentations. Downloading a chart as an image applies to all charts: Load Test, Continuous Test, and Appliance Health. To download a chart:
-
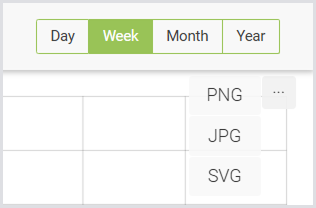
Locate the Download icon in the top right corner of the chart.
-
Select image format: PNG, SVG, or JPG.
-
Download the image. It will be saved to your Downloads folder, or the directory you've configured as your default Downloads location.
Notifications
User Interface
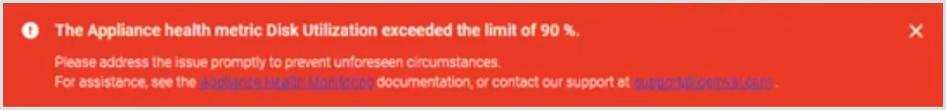
The Appliance Health Monitoring interface includes persistent notifications that provide real-time alerts about system health. Currently, these notifications cannot be disabled and will always appear when certain thresholds are exceeded.
Key features:
-
Threshold alert: A notification appears when disk usage exceeds 90%.
-
Dismissal: You can dismiss the notification; however, this action is saved only for the current session. If the issue is not addressed and you relaunch the browser, the notification will reappear. It will not reappear for the same session after dismissal.
-
Display timing: Notifications are triggered in 20-minute intervals. If you log in shortly after the check, you may not see the alert immediately, leading to a potential wait of up to 20 minutes for the notification to appear.
Email Notifications
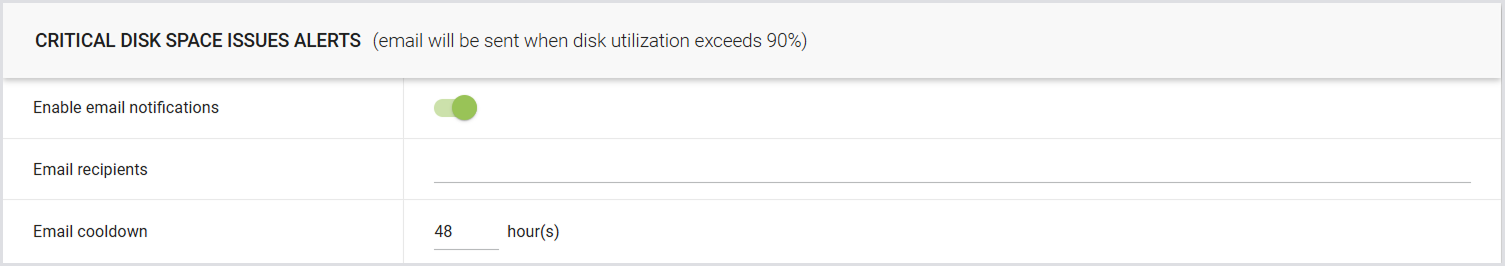
The Appliance Health Monitoring system allows for customizable email notifications to keep you informed about critical issues.
Configuration options:
-
Enable/Disable notifications: You can easily enable or disable email notifications based on your preferences.
-
Recipient settings: Specify recipients to receive alerts when disk usage exceeds the 90% threshold.
-
Cooldown period: The default cooldown period is set to 48 hours. This means that if a notification is sent due to high disk usage, the system will check again after 48 hours before sending another email. If the issue is resolved within that timeframe, no further emails will be sent.
Note: Email notifications are currently only available for disk usage alerts, triggered by the same threshold of over 90% disk capacity.
Goals and Takeaways
-
Proactive monitoring: Stay ahead of potential issues by keeping an eye on critical metrics.
-
Informed decisions: Use the data to make decisions about resource allocation and maintenance.
-
Efficient operation: Ensure that your Appliance runs smoothly and efficiently by addressing issues before they impact performance.