Overview
Session Metrics are Windows performance metric data that are collected by the Engine throughout a Test Run. They are user-defined, so you can collect any Windows counter that the Virtual User has access to. When the Test Run starts, the Engine collects all of these user-defined performance counters for the duration of the Test and reports them back to the Appliance as part of your Test results. Session Metrics are displayed in charts for Load Tests and Continuous Tests.
Important: Charts only display metrics with the same unit (%, Ops/Sec, Bytes, etc.) simultaneously. This unit is set when you structure a Session Metric Definition for an API Request.
Administrators can collect additional performance metrics from Windows Performance Monitor (PerfMon) and Windows Management Instrumentation (WMI) to display with EUX Score and Application metrics. When enabled, Session Metrics are captured every 5 seconds by default.
The system captures and displays the percentage of CPU and Memory Utilization by default. For details, see Built-In Session Metrics.
Note: You can use the Session Metrics Library with examples of WMI and PerfMon Session Metric definitions. These are provided as examples only.
Login VSI has limited ability to recommend particular metrics for data collection. The customer is responsible for understanding and defining metrics for their monitoring needs.
Why Use Session Metrics?
|
Benefit |
Description |
|---|---|
|
Improved root cause analysis during Load Testing |
Session Metrics allow administrators to collect performance data from target Windows VDI or PCs during load tests. This makes it easier to correlate degraded EUX Scores or reduced VSImax density with system metrics such as CPU, memory, disk utilization, and other performance counters. |
|
Identify resource-heavy applications and processes |
Session Metrics help pinpoint agents, applications, or processes that consume large amounts of system resources, allowing teams to identify factors impacting system performance and scalability. |
|
Better visibility for optimization and capacity planning |
With a complete view of the workspace under stress, teams can analyze detailed performance data, fine-tune optimization settings, and measure the impact of configuration or infrastructure changes. |
|
Granular comparison between test results |
When comparing two test runs, Session Metrics help identify detailed changes in key performance indicators, enabling teams to understand how updates or configuration changes affect resource consumption. |
|
Continuous real-time monitoring |
For Continuous Testing, Session Metrics can be collected in real time, 24/7, without requiring an additional agent, simplifying ongoing monitoring of infrastructure performance. |
|
Early detection of infrastructure issues |
By correlating performance counters such as CPU and memory utilization with EUX Score degradation, logon times, or application response timers, Session Metrics can serve as an early warning system for infrastructure problems. |
|
Application performance tracking across versions |
Session Metrics allow administrators to measure application-specific resource utilization across version updates and upgrades, helping evaluate performance changes introduced by new releases. |
|
Visibility into GPU and graphics-intensive workloads |
Using WMI metrics, Session Metrics provide visibility into GPU usage, supporting accurate testing and tuning of graphics-intensive workloads. |
|
Monitoring of platform-specific protocols and video quality |
Platform-specific metrics such as ICA/HDX and Blast protocol information can be correlated with collaboration workloads like Zoom or Teams to evaluate video quality metrics such as frames per second during capacity testing. |
Tech Tips
When you enable Session Metric collection using Custom Metrics Groups, adding additional metrics to a Group increases resource consumption. This may impact the expected EUX Score and VSImax results. For this reason, consider capturing a benchmark of your EUX and VSImax before enabling Session Metrics. This will help assess the impact of collecting the session metrics you’re interested in. You can also change the way Session Metrics are gathered in the Test definition by setting the proportion of your end-user Test targets that will gather Session Metrics.
Before you create a WMI query, define the performance counters you want to collect. This will minimize query overhead. For better performance, choose PerfMon over WMI when a specific session metric is available in both sources.
Built-in Session Metrics
There are two built-in Session Metrics that Login Enterprise comes pre-configured with. These are "CPU utilization" and "Memory utilization". Both of these metrics are expressed as a percent.
-
CPU Utilization is simply the PerfMon counter "Processor Information", "% Processor Utility", "_Total".
-
Memory Utilization is a hybrid counter. There is no native PerfMon counter that expresses memory utilization as a percent. We use "Memory", "Available MBytes" from PerfMon, and use WMI to capture the query "SELECT Capacity FROM Win32_PhysicalMemory". The WMI query returns bytes, so we convert to MB and calculate 100 * (capacity - available) / total to get the in-use percentage.
Creating Custom Session Metrics
The first step you need to take is to define the performance counters you want to collect.
-
For performance counter details about PerfMon, see Performance Counter Details for PerfMon.
-
For performance counter details about WMI, see Performance Counter Details for WMI.
Windows Performance Monitor (PerfMon)
Performance Counter Details
Windows Performance Monitor (PerfMon) is a Windows tool designed for analyzing the performance of applications and the overall system. It offers a variety of performance counters covering CPU usage, memory usage, disk activity, and network performance. Each counter will have details such as its name, description, and instance information.
The steps below explain how to find details about specific performance counters in PerfMon on your Windows system:
-
Launch PerfMon: Open Performance Monitor on your Windows system. You can usually find it in the "Administrative Tools" or by searching for "perfmon" in the Start menu.
-
Add the Desired Counter: In PerfMon, click "+" to add a performance counter. Choose the performance object (category), counter (specific metric), and, if applicable, instance (e.g., for a specific process).
Suppose you want to monitor the "% Idle Time" performance counter for logical disks. This metric reports the percentage of time during the sample interval that the selected disk instance, or aggregate of all disk instances, was idle. In the following example, the red outline indicates the 'counterCategory,' the yellow outlines the 'counterName,' and the purple highlights the 'counterInstance'. Make sure you have copied the counterCategory, counterName, and counterInstance of your performance counter, for example, in Notepad, as you will need them in further steps.
You can adapt the formula for other performance counters depending on your monitoring scenario.
Once you’ve identified the PerfMon performance counters you’d like to collect with Login Enterprise, you need to create and import your Session Metric definition.
To create a PerfMon Session Metric in the Login Enterprise UI, see Creating a PerfMon Session Metric Definition in the UI.
Windows Management Instrumentation (WMI)
Performance Counter Details
Windows Management Instrumentation (WMI) is a powerful management framework in Windows for monitoring, configuration management, event handling, and remote administration of your system. WMI provides more detailed information than PerfMon, making it preferred in certain scenarios.
To identify available WMI performance counters, start by collecting available WMI classes. To do this, open the PowerShell console on your Windows system.
-
Using the Start Menu:
-
Click on the "Start" button.
-
Type "PowerShell" in the search bar.
-
Click on "Windows PowerShell" or "PowerShell" to open the PowerShell console.
-
-
Using Run:
-
Press Win + R to open the Run dialog.
-
Type "powershell" and press Enter.
-
To retrieve a list of all available WMI classes that can be queried, use the following command:
Get-WmiObject Win32_PerfFormattedData | Select-Object -Unique __Class | Format-Table -AutoSize
In this output, some examples of significant WMI classes related to performance monitoring include:
-
Win32_PerfFormattedData_PerfOS_Processor
-
Provides processor performance information, including CPU usage, interrupts, and related statistics.
-
-
Win32_PerfFormattedData_PerfOS_Memory
-
Offers performance data related to system memory usage, including available bytes, cache size, and memory-related rates.
-
-
Win32_PerfFormattedData_PerfDisk_LogicalDisk
-
Provides performance data related to logical disks, including metrics for disk transfer rates, queue lengths, and average response times.
-
-
Win32_PerfFormattedData_GPUPerformanceCounters_GPUEngine
-
Contains GPU engine performance data, offering metrics for GPU utilization, video decoding, and processing activity.
-
-
Win32_PerfFormattedData_PerfOS_System
-
Offers performance data related to the overall system, including metrics such as context switches, system calls, and other counters.
-
-
Win32_PerfFormattedData_PerfProc_Process
-
Provides performance data related to individual processes, including CPU and memory usage.
-
-
Win32_PerfFormattedData_Tcpip_NetworkAdapter
-
Includes performance data related to network adapters, offering metrics such as bytes sent and received per second, packet rates, and error counts.
-
-
Win32_PerfFormattedData_Counters_VMwareBlastImagingCounters (specific to VMware Horizon only)
-
Contains performance data related to VMware Blast Imaging, offering metrics for imaging operations and bandwidth usage in a VMware Horizon environment.
-
Suppose you want to query the PhysicalDisk class. This WMI class provides performance data specifically related to physical disk drives on a Windows system. It includes various performance counters that allow you to monitor the performance and activity of individual physical disk drives. You can collect such metrics as DiskReadsPerSec (the rate at which read operations are performed on the disk) and DiskWritesPerSec (the rate at which write operations are performed on the disk), among others.
To retrieve all counters for the WMI class (in this example, PhysicalDisk), run the following command:
Get-WmiObject -Query "SELECT * FROM Win32_PerfRawData_PerfDisk_PhysicalDisk"
The SELECT * part of the query specifies that you want to retrieve all properties or counters available for each instance of the PhysicalDisk class, so the output may be extensive.
If you are looking for specific counters or properties, you can modify the query to include only the ones you are interested in. Suppose you want to collect the DiskWritesPerSec and DiskReadsPerSec metrics.
To retrieve specific counters (DiskWritesPerSec, DiskReadsPerSec), modify the command in the following way:
Get-WmiObject -Query "SELECT DiskWritesPerSec, DiskReadsPerSec FROM Win32_PerfRawData_PerfDisk_PhysicalDisk"
You can replace DiskWritesPerSec and DiskReadsPerSec with the specific counters you want to retrieve. By specifying only the desired properties in the SELECT statement, you focus the data returned and limit the performance overhead when polling the target system.
Once you’ve defined the performance counters for a WMI Session Metric definition, you need to create a WMI Session Metric definition.
To create a WMI Session Metric in the Login Enterprise UI, see Creating a WMI Session Metric Definition in the UI.
Creating a Session Metric
-
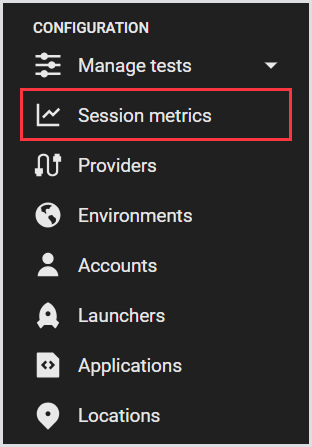
In the Login Enterprise sidebar menu, navigate to Configuration > Session metrics:
-
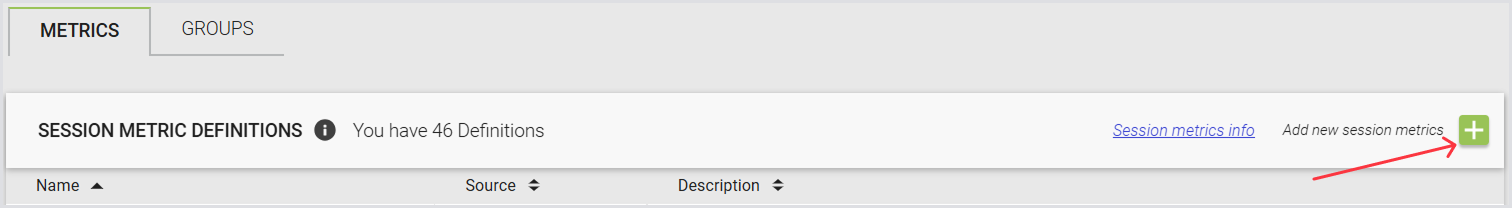
In Metrics, click the green “+” on the right to add a session metric.
Note: CPU and Memory utilization metrics are built-in (default ones) and cannot be deleted.
-
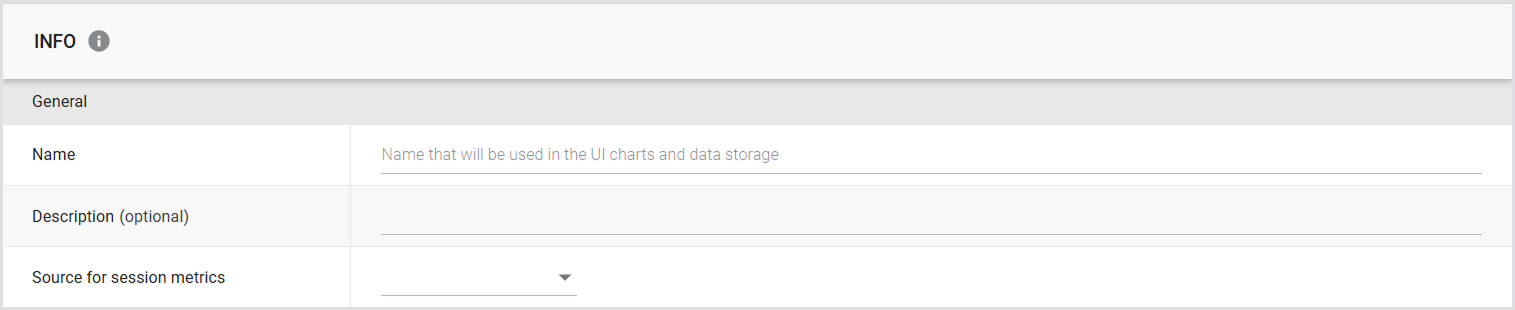
In the Create new session metric window, provide the general information for your session metric:
Creating a PerfMon Session Metric Definition
-
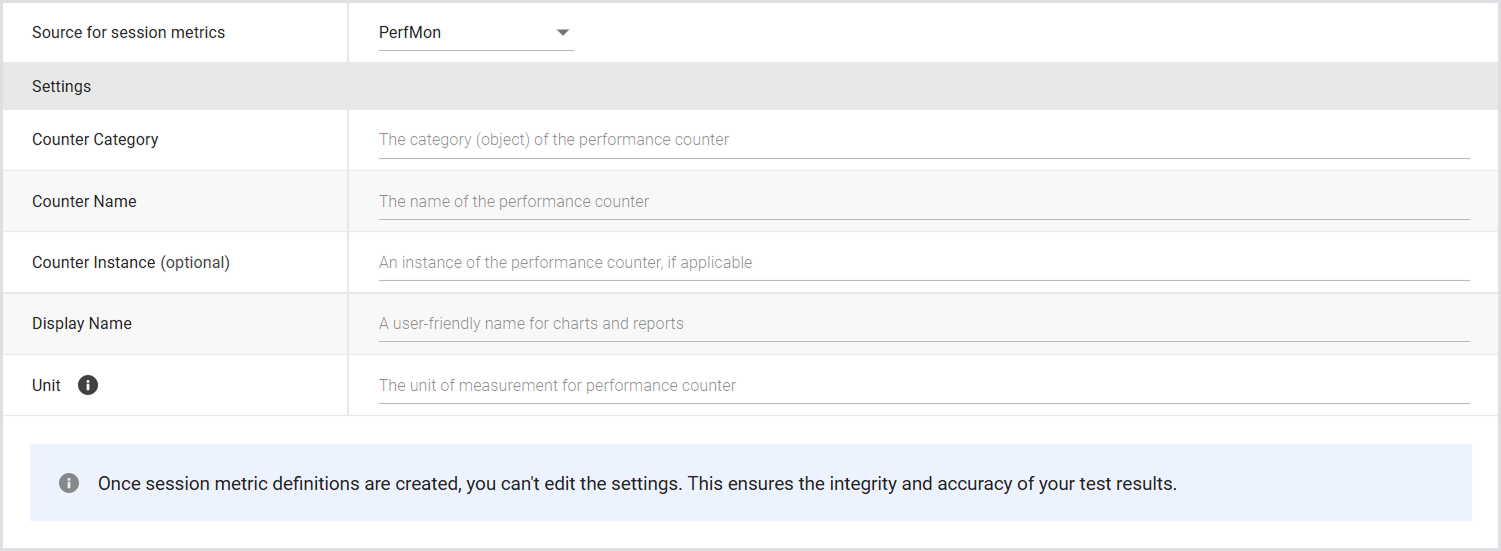
In Settings, provide the following information for a PerfMon session metric definition:
|
Settings |
|
|---|---|
|
Counter Category |
The category (object) of the performance counter. |
|
Counter Name |
The name of the performance counter. |
|
Counter Instance (optional) |
An instance of the performance counter, if applicable. |
|
Display Name |
A user-friendly name for charts and reports. |
|
Unit |
The unit of measurement for the performance counter. This label appears on the y-axis for charts showing the metric. Note that charts only display metrics with the same unit simultaneously. |
-
Save your settings to apply the changes. If you have more metrics to add, continue following the steps for each.
Once you’ve created a PerfMon Session Metric definition, you need to create a Group for Session Metric Definitions.
Creating a WMI Session Metric Definition
In Settings, provide the following information for your WMI session metric definition:
|
Settings |
|
|---|---|
|
WMI Query |
The WMI query statement for data collection. Use the SELECT, FROM, WHERE format. |
|
Name Space |
The namespace to specify the database for the query. When left blank, the default namespace, "root\cimv2" will be used. |
|
Instance Field |
The name of the field that describes the instance. Note this is NOT the actual instance name. For example, if you use '_Total' as an instance, you would reference the 'Name' column in the dataset listing the instances. |
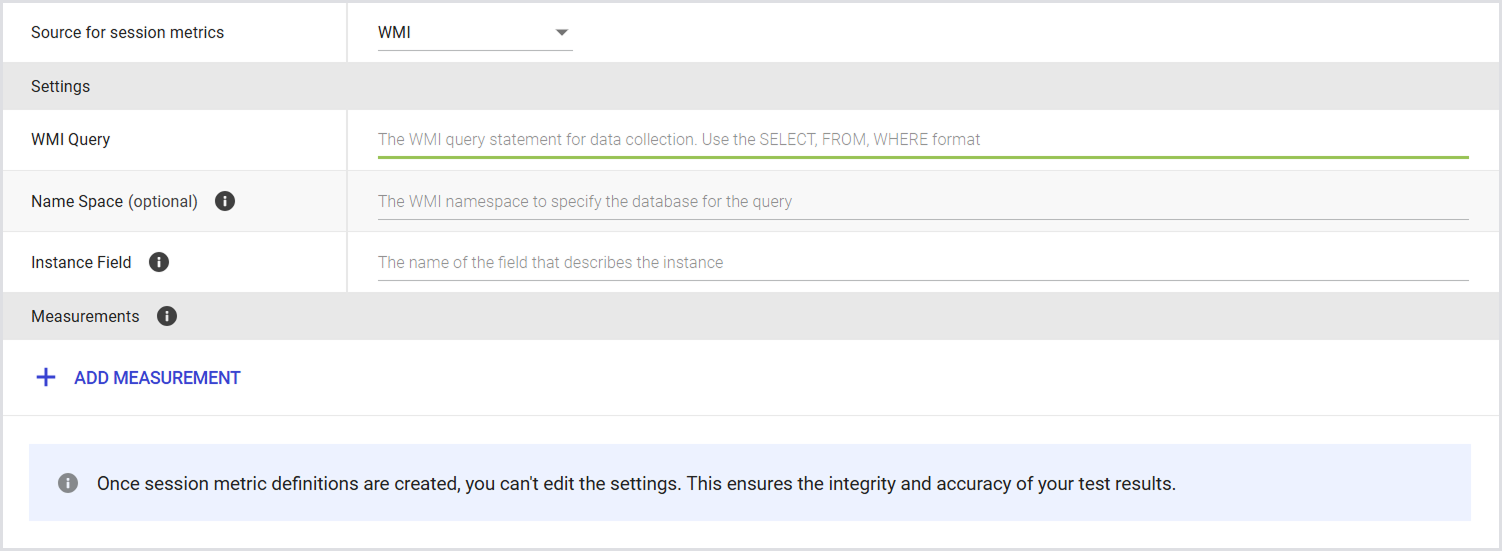
Tip: You can add measurements for monitoring system performance, troubleshooting, and establishing baselines. Measurements provide the data needed for performance analysis, capacity planning, and proactive issue identification. They enable alerts, trend analysis, and optimization, supporting effective system management and adherence to service level agreements (SLAs). For details, see Adding a Measurement.
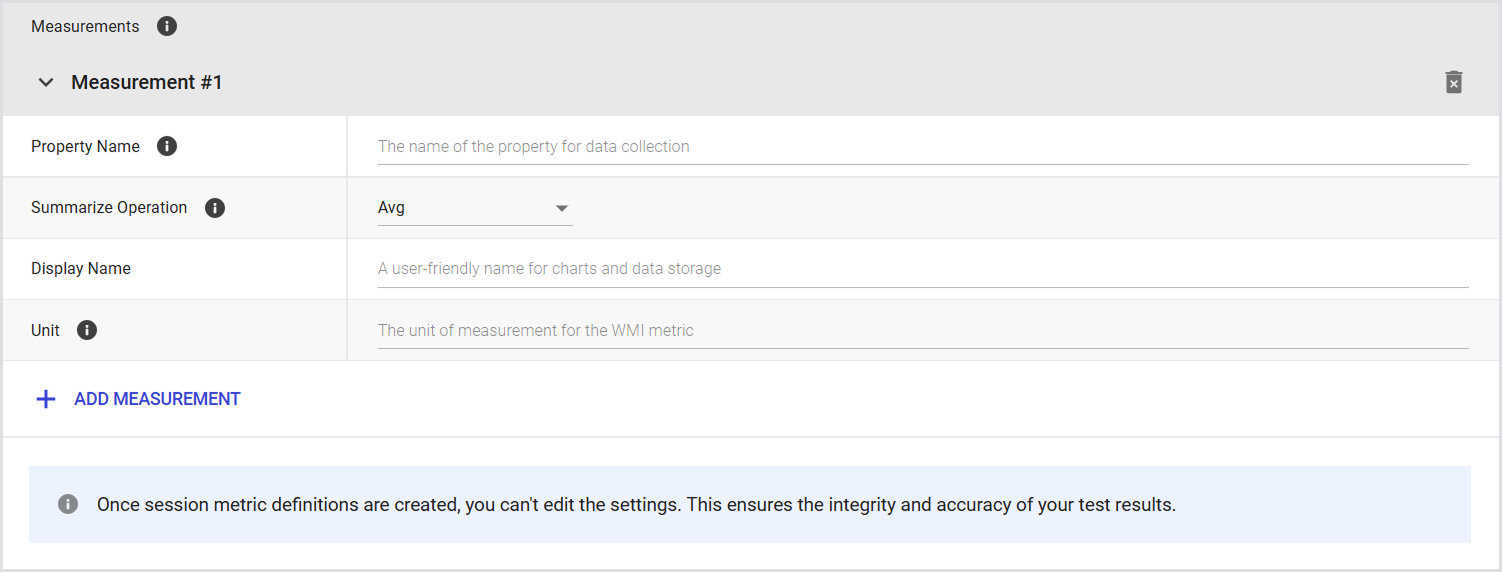
Adding a Measurement
-
To create a new measurement, click Add Measurement and provide the following information:
|
Measurements |
|
|---|---|
|
Property name |
The name of the property for data collection. |
|
Summarize operation |
The summarization operation for the measurement, e.g., Min, Max, Avg, etc. If set to None, up to 16 instances will be returned in a random order. |
|
Display name |
A user-friendly name for charts and data storage. |
|
Unit |
The unit of measurement for the WMI metric. This label appears on the y-axis for charts showing the metric. Note that charts only display metrics with the same unit simultaneously. |
-
Save your settings to apply the changes. If you have more metrics to add, continue following the steps for each.
Once you’ve created a WMI Session Metric definition, you need to create a Group for Session Metric Definitions.
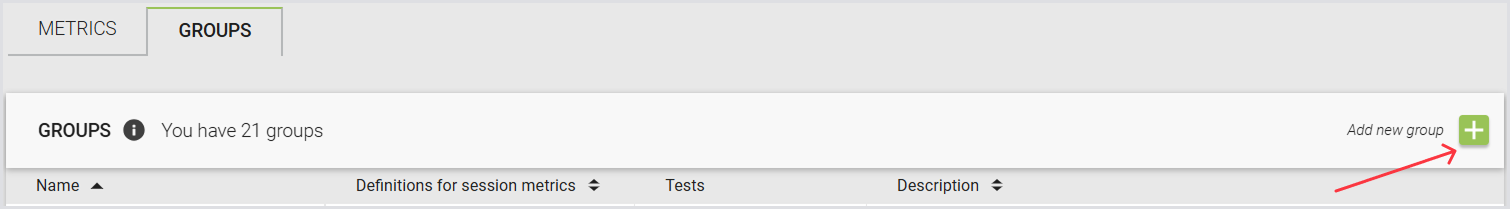
Creating a Group for Session Metric Definitions
A Group is a collection of previously specified session metrics. Note that at the test level, you can connect only one Group. The Group can have as many session metric definitions as you would like, but the test can only contain one group. To create a new Group for Session Metric definitions:
-
In Session metrics, select Groups from the tab menu.
-
Click the green “+” on the right to add a Group.
-
In the Add new group window, provide the general information:
|
General |
|
|---|---|
|
Name |
A name for the Group to easily identify and categorize related metrics. |
|
Description (optional) |
A brief description of the Group, if applicable. |
.png?cb=60157caec910c389c8e4b247c8476f16)
-
Save your settings to apply the changes. If you have more Groups to add, continue following the steps for each.
Once you’ve created a Group, you need to add Session Metric Definitions to a Group.
Adding a Session Metric Definition to a Group
-
In Session Metric Groups, select Definitions from the tab menu.
-
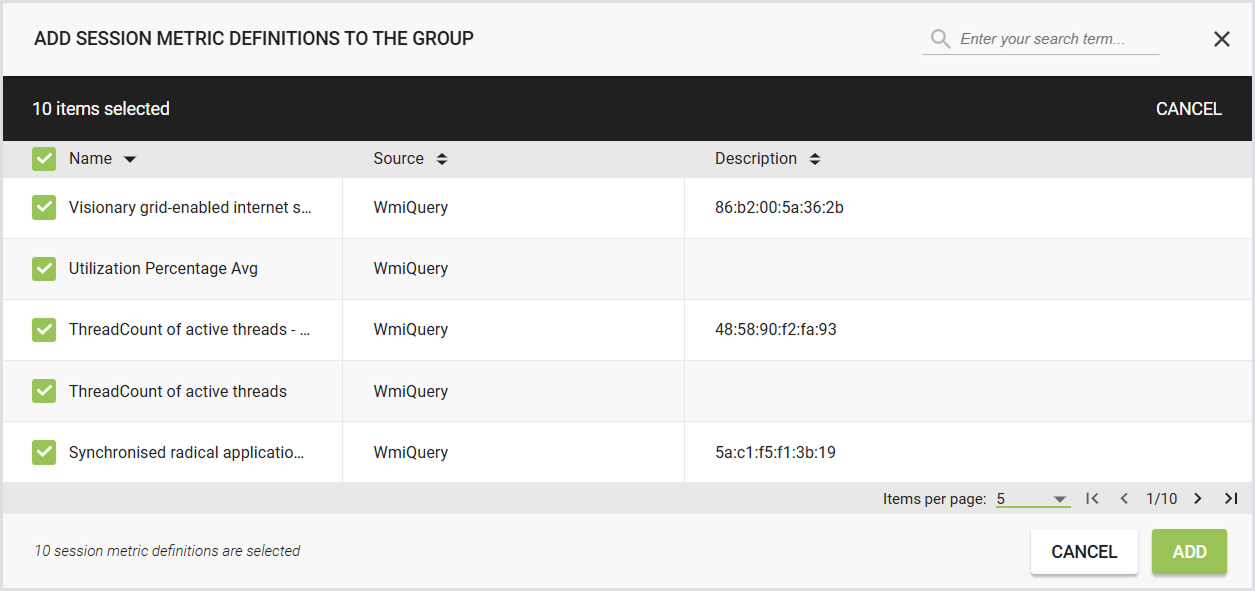
Click Add session metric definitions.
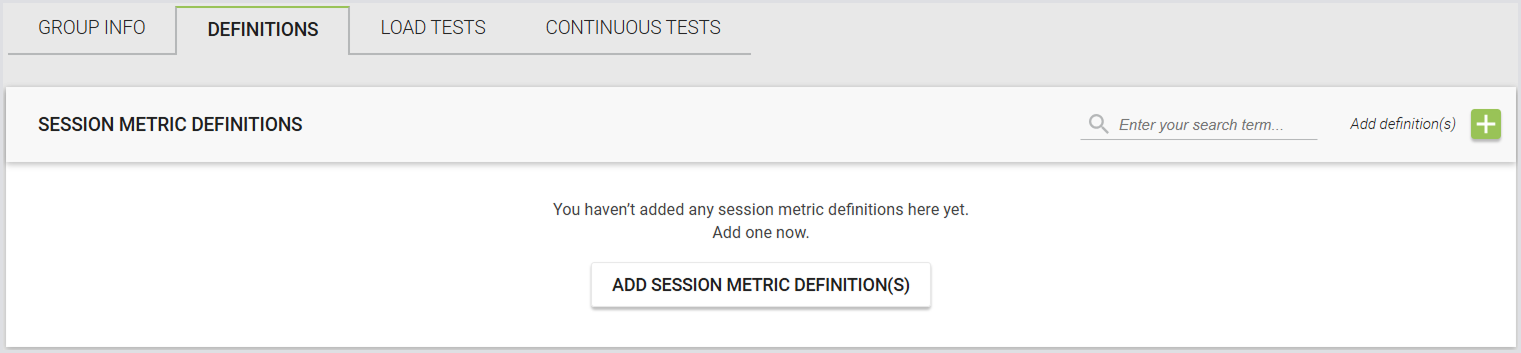
-
Select the checkboxes next to the Session Metric definitions to add them to a Group, and click Add.
Tip: You can select individual definitions or select all by using the checkbox in the Name column.
-
Click Save.
Once you’ve added Session Metric definitions to a Group, you need to link the Group to a Test. This way, the Test will capture the metrics specified in the Group.
Removing a Session Metric Definition from a Group
-
Go to your preferred Session Metric Group, and select Definitions from the tab menu.
-
Select individual definitions or select all by using the checkbox in the Name column.
-
Click Remove. The removed definitions will remain in the list but appear greyed out, indicating they are marked for removal.
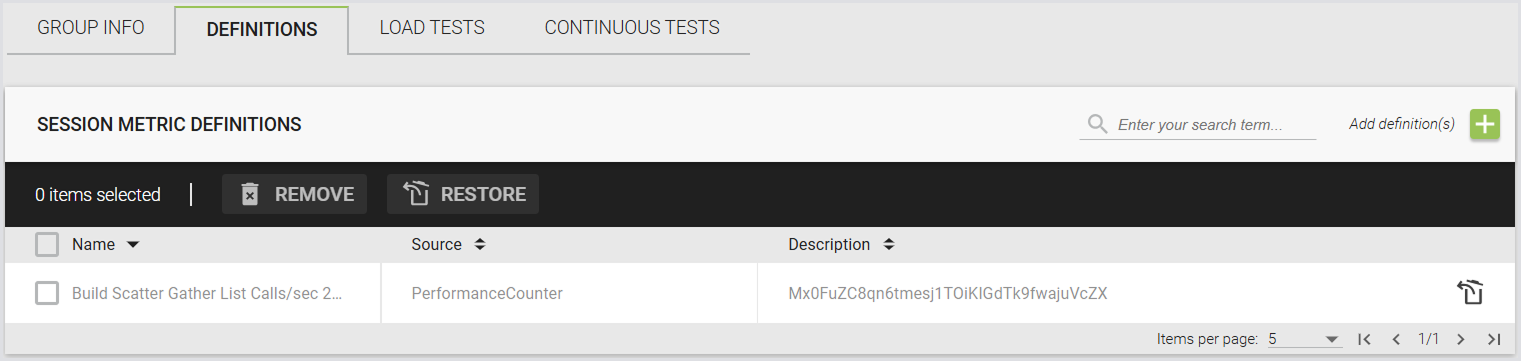
-
Click Save to apply the changes. The greyed-out rows will disappear once the changes are saved.
Linking a Group to a Test
-
In the Login Enterprise Sidebar menu, navigate to Configuration > Manage tests.
-
In Manage tests, select Continuous tests or Load tests from the dropdown.
Note: Session Metric Groups are supported only for Continuous tests and Load tests.
-
Click on the test.
-
In Test settings > Session metrics > Metrics group, select the Session Metric Group from the dropdown.
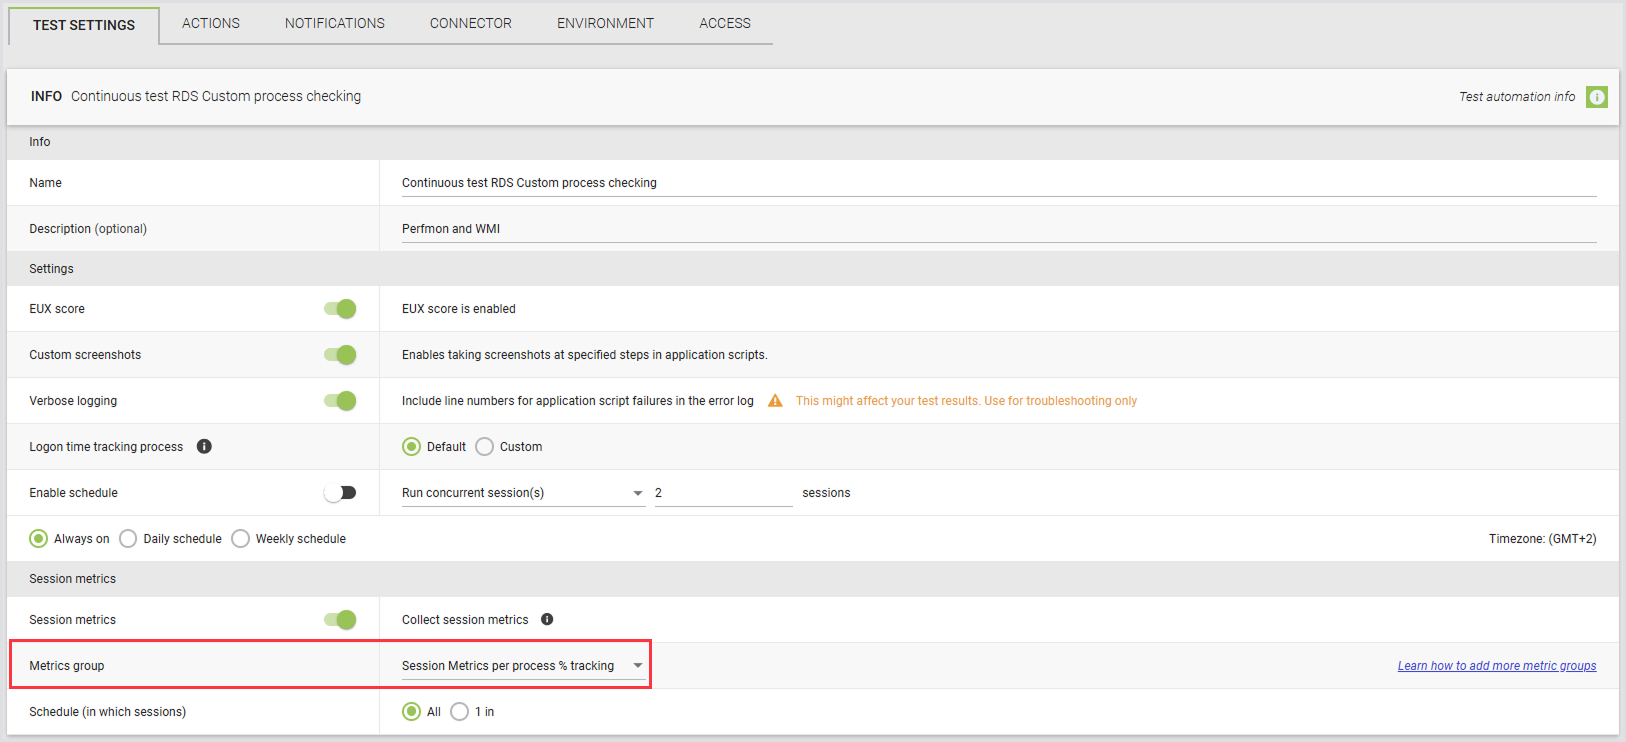
Tip: You can control the frequency of Session Metric polling to manage performance overhead. This allows you to specify whether metrics are collected from each session or only from 1 out of X sessions. It’s a useful tool you can use to balance the need for metrics gathering, particularly in medium to large-sized Session Metric Groups.
Viewing Session Metrics
For general guidelines on how to analyze your Continuous Testing and Load Testing Session Metrics, consult Viewing Session Metrics.
Additional Resources
To learn how to export raw data, including Session Metrics, see, e.g., Exporting Raw Data for Continuous Tests.