Introduction
You can view the results of a single Application Test and compare up to 5 Application Test instances. The Application Test Results page provides a comprehensive overview of measurements and detailed events for each Test. You can also download both single and multiple Test results as PDF reports for easy sharing and analysis.
Single Test
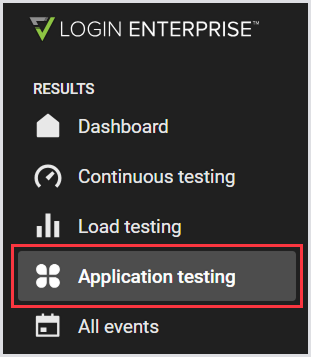
When an Application Test is completed, you can start looking at the results. To do this, in the Login Enterprise sidebar menu > Results, navigate to Application testing.
Single Test Summary
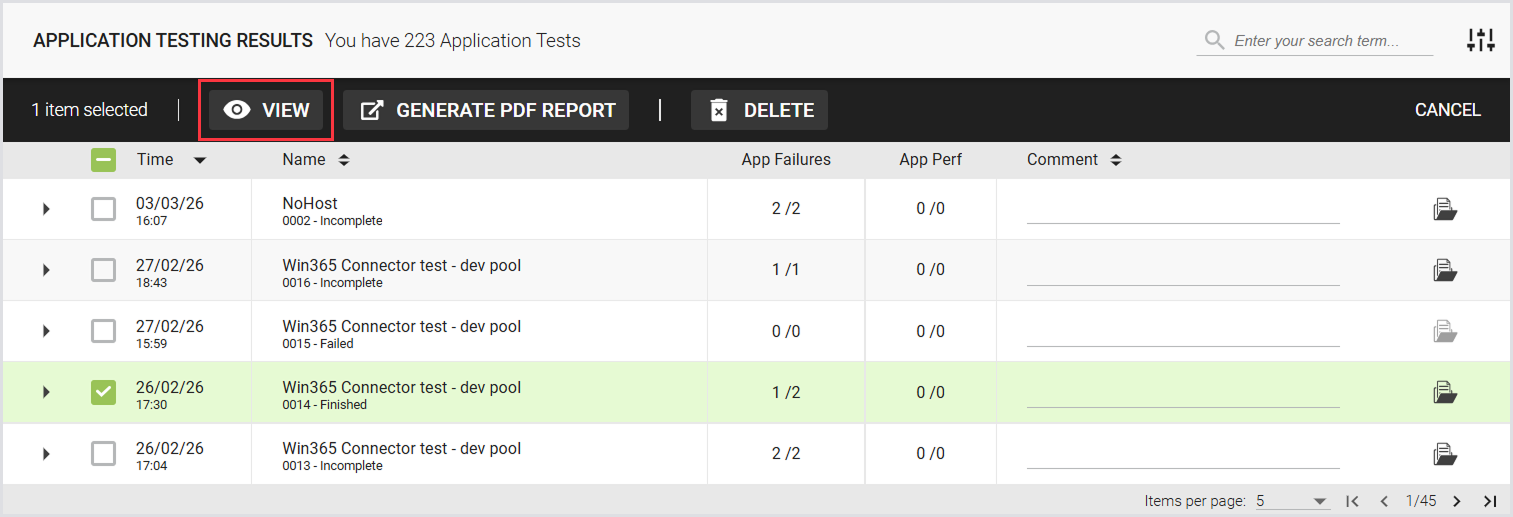
The summary page displays a list of previously executed Application Tests and includes the following:
|
Time |
Name |
App. Failures |
App. Perf |
Comment |
|---|---|---|---|---|
|
Date and time of the Test. |
Name and sequence number of the Test. |
The number of failed applications relative to the total number of applications tested. |
The number of out-of-bound measurements, compared to the configured thresholds. The number on the right shows the total number of configured measurements. |
The configured comment for the Test. |
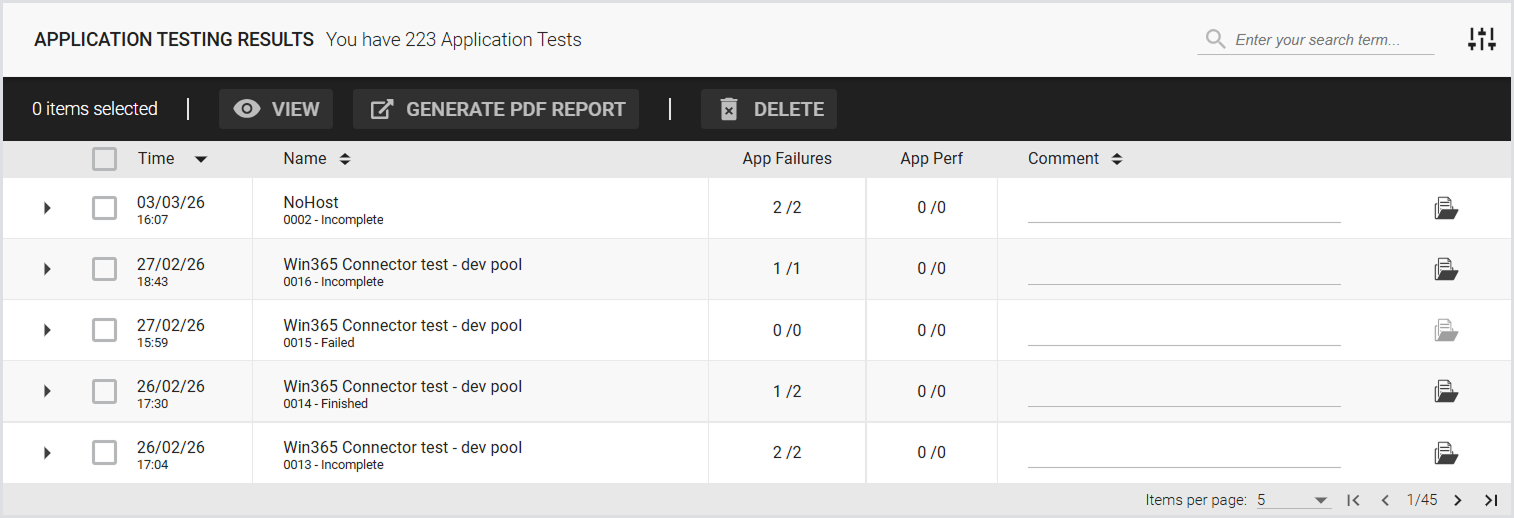
To view the Test details, click on the Test you’re interested in:
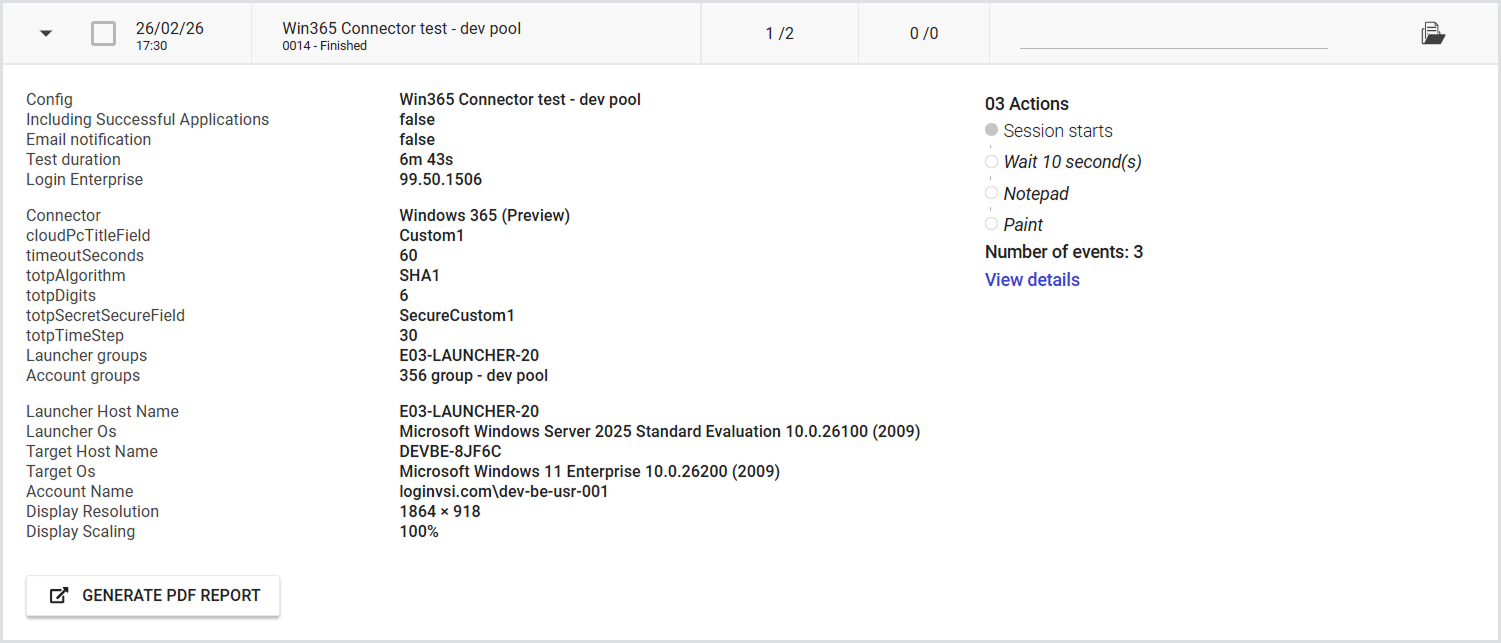
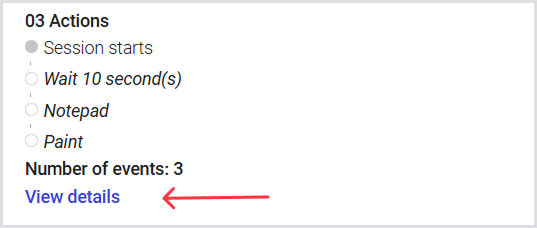
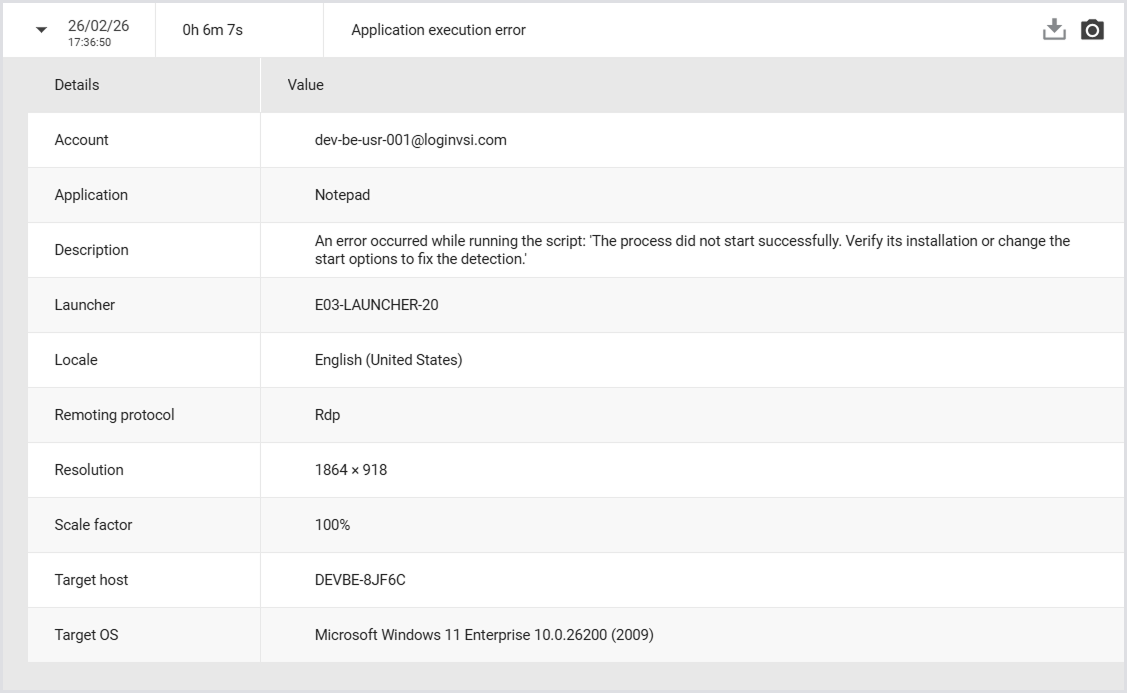
Tip: View details of events that occurred during the test. Click View details to open a pop-up with additional information.
If the Test includes application errors, you can expand the details, download the log file, or open the screenshot using the camera icon.
Single Test Results
To view the test results for a single test, select a test and click View.
The following page displays the Test summary, Overview (Platform summary and Application summary), Events, and Access.
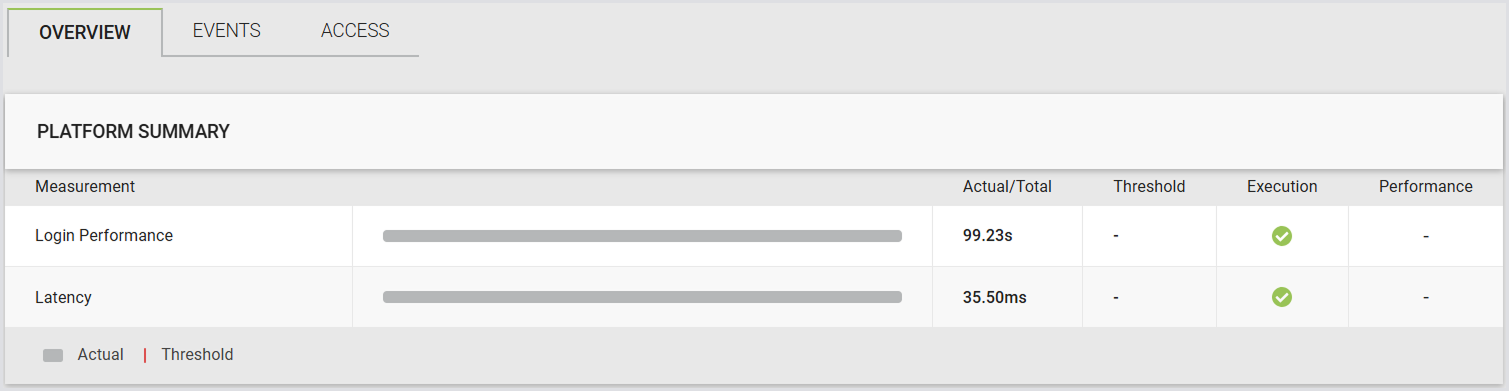
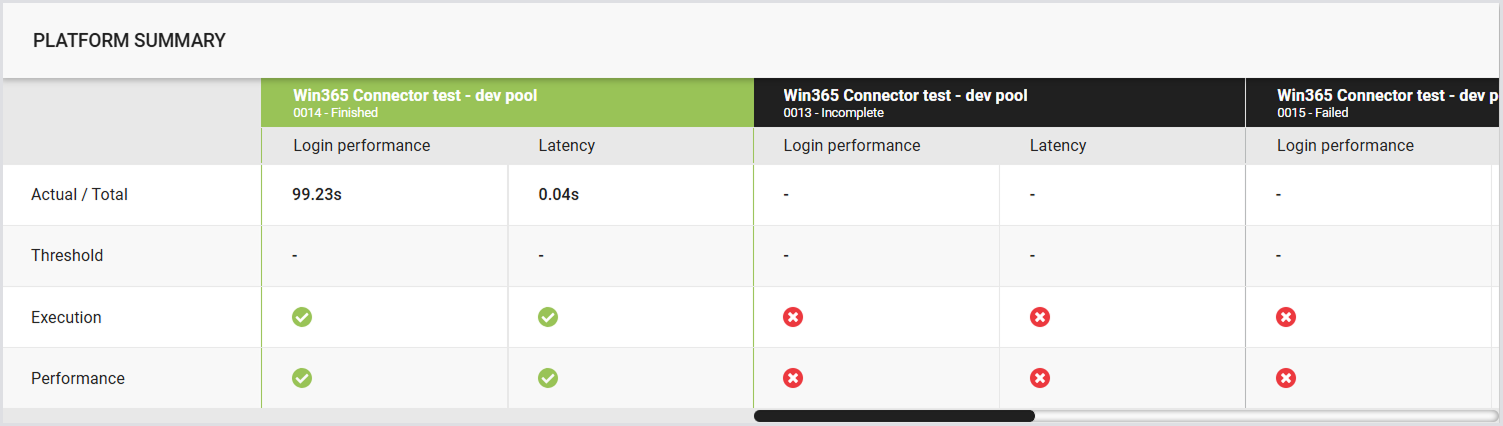
Platform Summary
|
Logon performance |
||||
|---|---|---|---|---|
|
|
Actual |
Threshold |
Execution |
Performance |
|
The actual time it took to log in. |
The login time threshold set in the Test. |
Green if the login was successful, regardless of the time taken. |
|
|
|
Latency |
||||
|
|
Actual |
Threshold |
Execution |
Performance |
|
The actual latency in milliseconds (ms). |
The latency threshold set in the Test, in milliseconds (ms). |
|
|
|
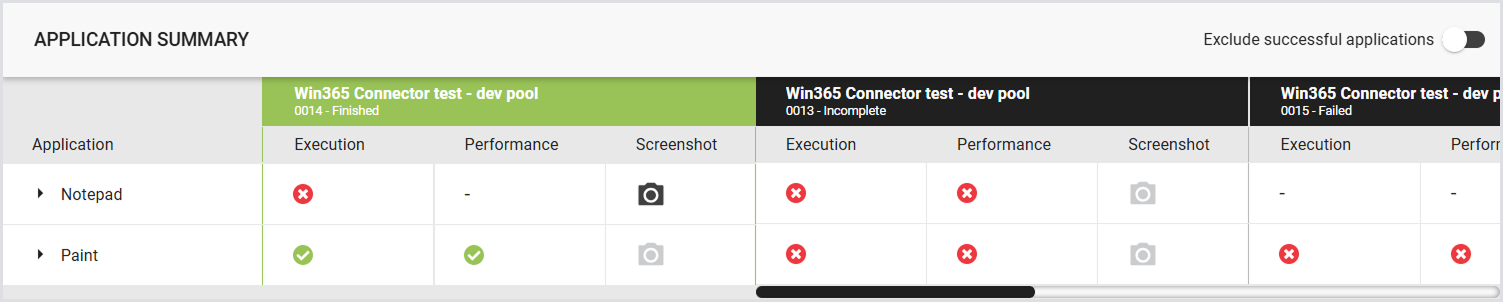
Application Summary
|
Application(s) |
|||
|---|---|---|---|
|
|
Execution |
Performance |
Screenshot |
|
|
|
|
|
Measurements (Timers) |
|||
|
|
Actual |
Threshold |
Status |
|
The actual time recorded for the measurement. |
The threshold set in the Test for the specific measurement. |
|
|
By default, the measurements (timers) include the app start time. The app start time is automatically recorded when the START function in the workload scripts is executed. This function is used by default to launch target apps. Additionally, any custom timers defined in the workload scripts will also be displayed in the UI. To learn how to configure custom timers, see the Scripting Functions Overview.
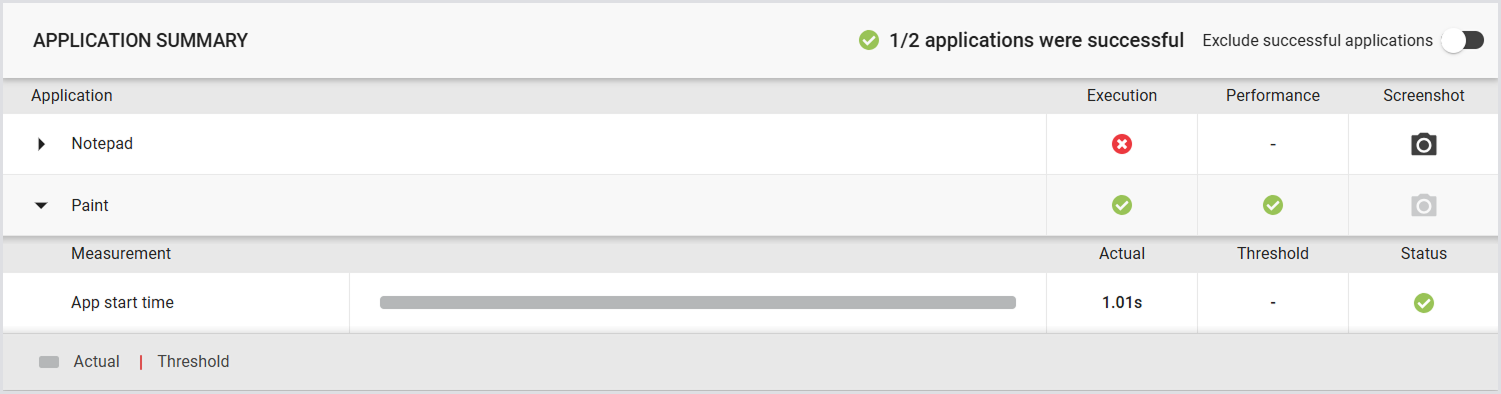
You can choose to show only applications with failed events. This helps you quickly identify failures and troubleshoot issues.
.png?cb=91a4da4f6c67875197e9f9a21aa8ead5)
Tip: To scroll horizontally, drag the scrollbar, or place your cursor over the table, hold Shift, and use the mouse wheel.
Generating a Test PDF Report
Automatically
A single Application Test PDF report is automatically generated once the Test is finished. Download the report by clicking the Download button next to the Test:

Note: This is the report for which you can set email notifications. For more information, see the Report Settings.
Manually
Generate a new single Test PDF report manually or using the Public API. To generate the report:
-
In the Application Testing results, click on the Test you’re interested in.
-
Click Generate PDF report (A browser pop-up will open).
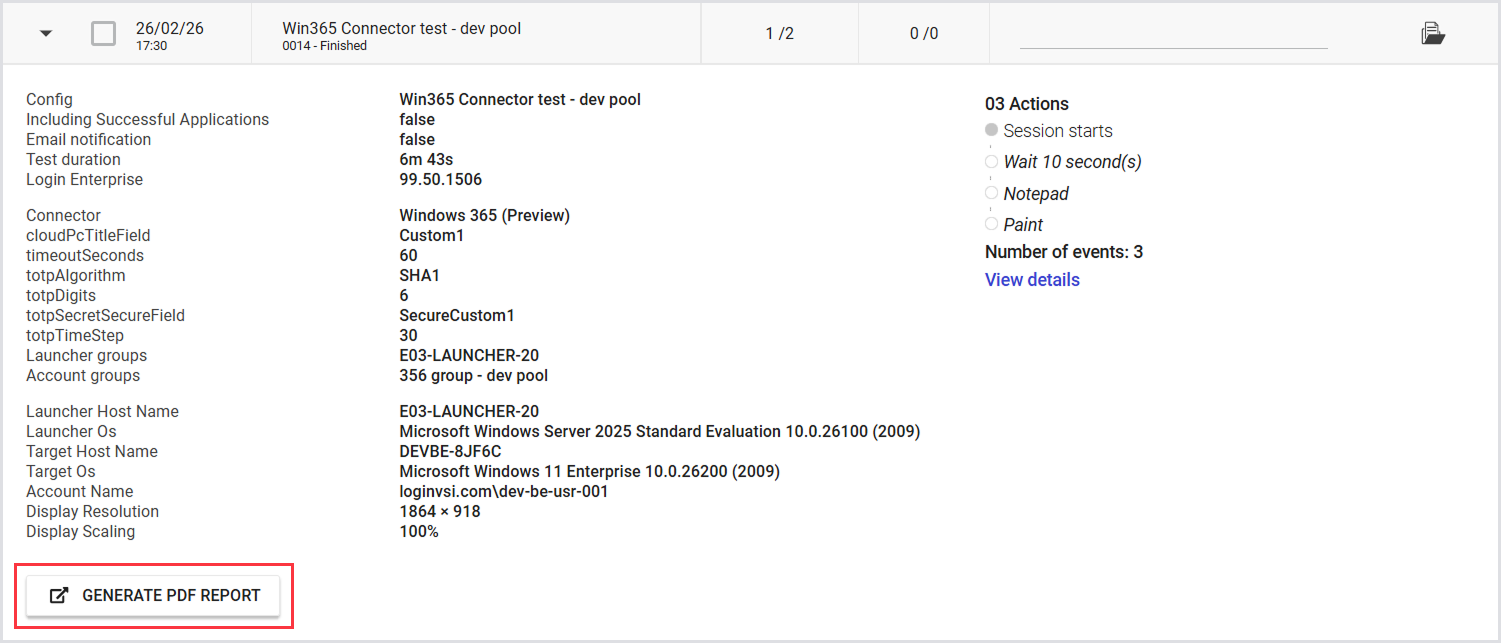
-
In the Generate PDF report pop-up, configure the report according to your needs by ticking off the info you want to include. For details and examples, see Configuring a Test PDF Report.
-
Click Generate, and then Save.
Tip: Alternatively, select the checkbox next to the specific Test, and in the top menu toolbar, click Generate PDF report.
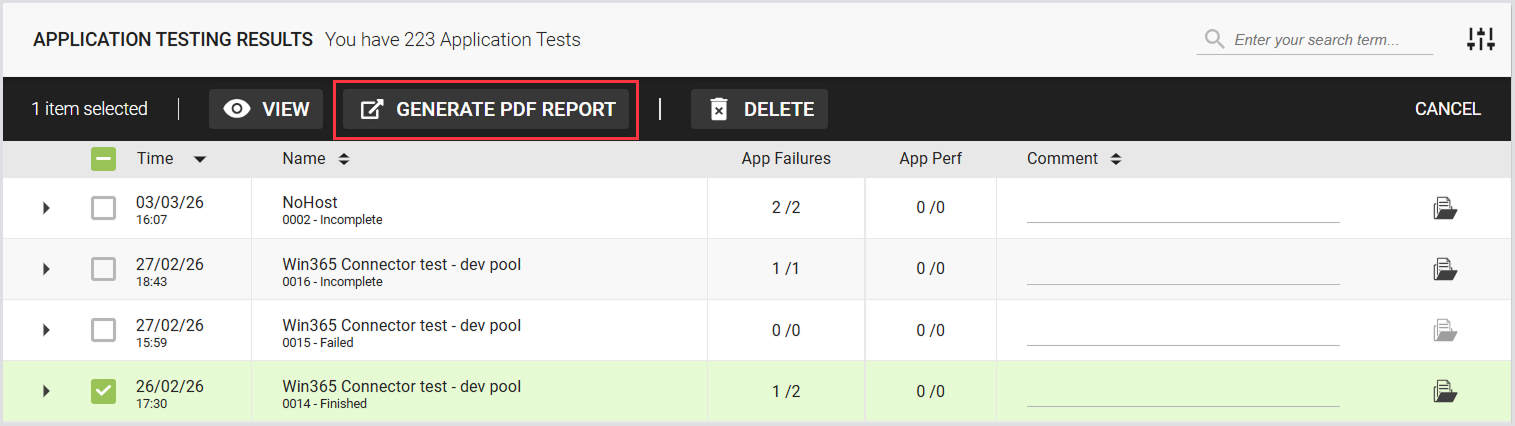
Note: Email notifications for a single Application Test report generated manually aren’t supported.
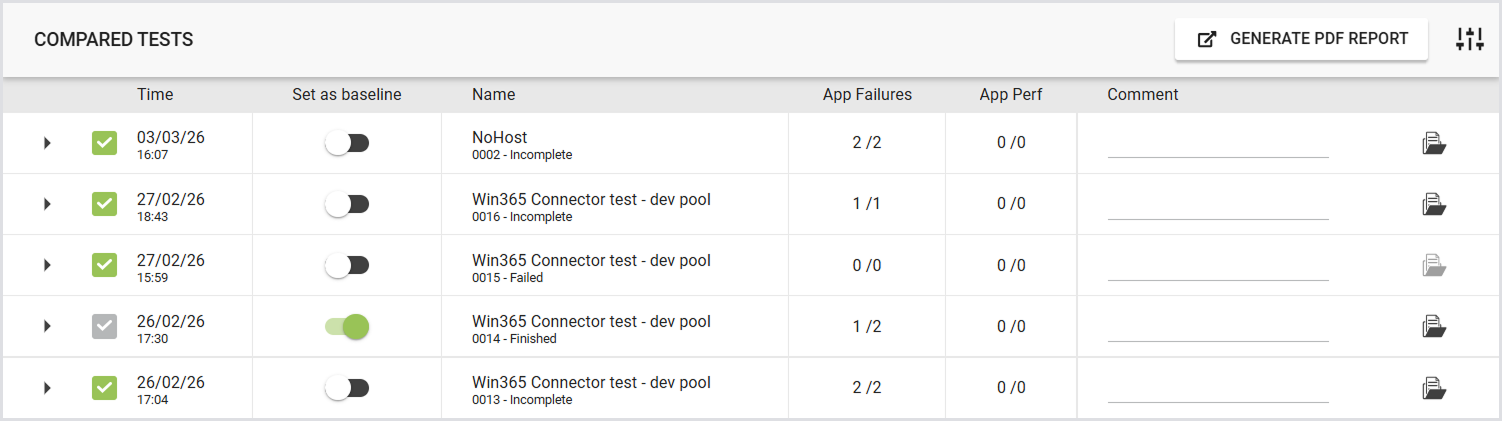
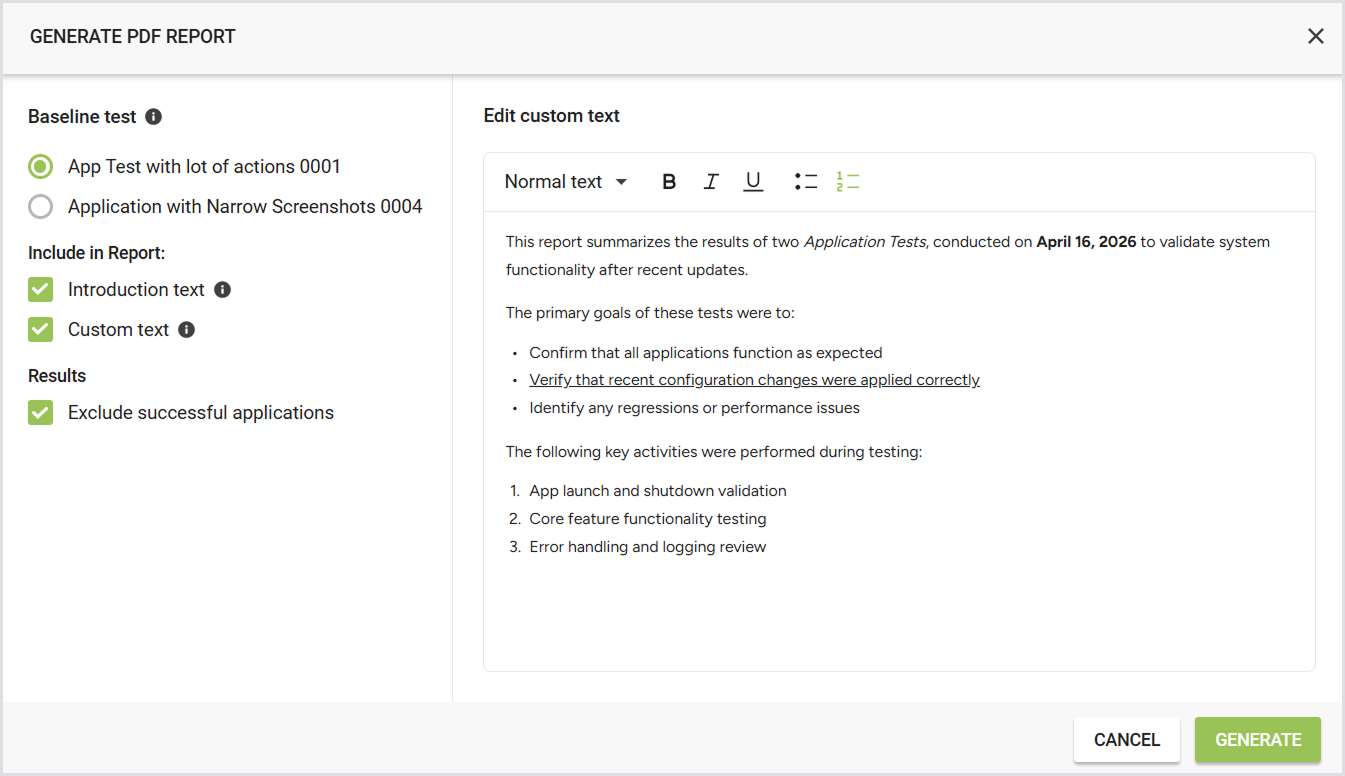
Compared Tests
To view the test results for the compared tests, select up to 5 tests and click Compare.
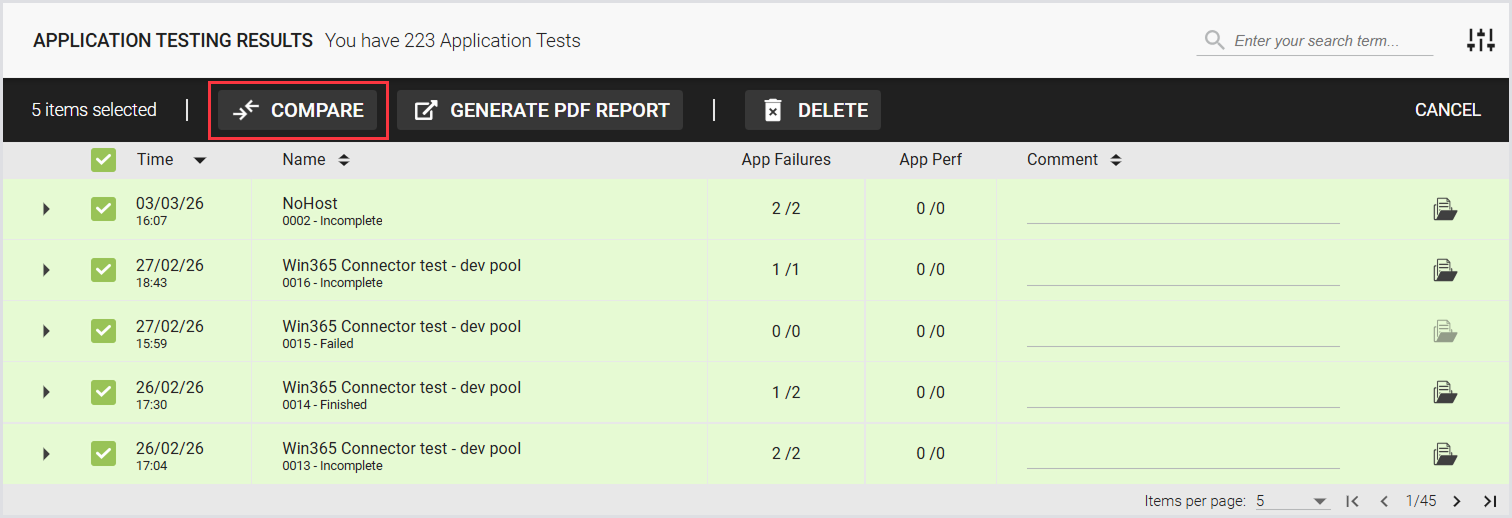
The following page displays the summary of the compared Tests, Overview (Platform summary and Application summary), and Events.
Compared Test Summary
This is where you can select a Baseline Test to compare other Application Tests against. Use the checkboxes to add or remove tests from the comparison.
Compared Test Results
Platform Summary
Displays the login time and latency, along with the percentage difference between the compared Tests. For details, see the Platform Summary.
Application Summary
Compares the results of the Application scripts. For details, see the Application Summary.
Note: The results of the Baseline Test are pinned in the first column. The other Test columns are sorted from oldest to newest.
If the results do not fit the screen, scrollbars will appear in the table. The baseline Test column remains pinned and does not move with the scrollbar.
The results of the Baseline Test are the primary reference. All Applications and timers from the baseline are displayed. If a selected Test has additional Applications or timers not present in the Baseline Test, those will only be shown when that Test is designated as the baseline.
The PDF report for the multiple Application Test comparison isn’t available yet.
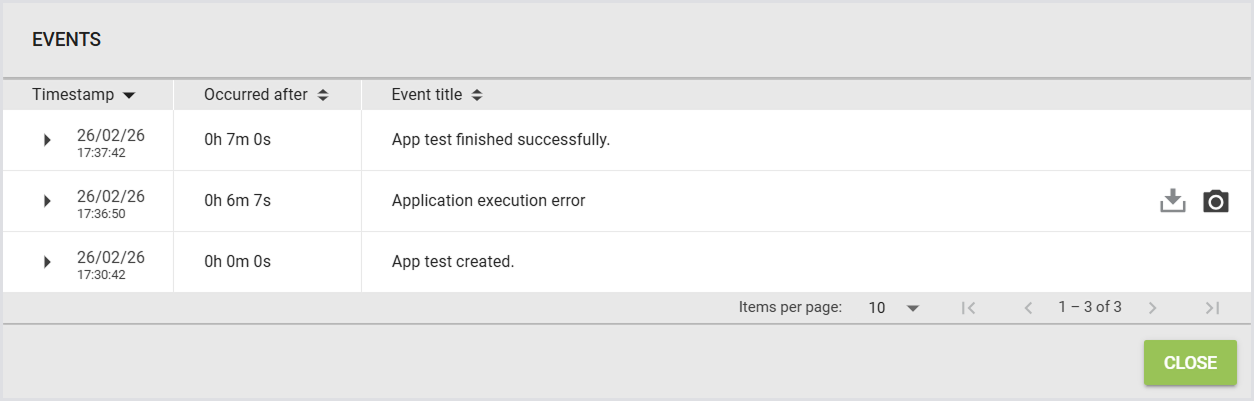
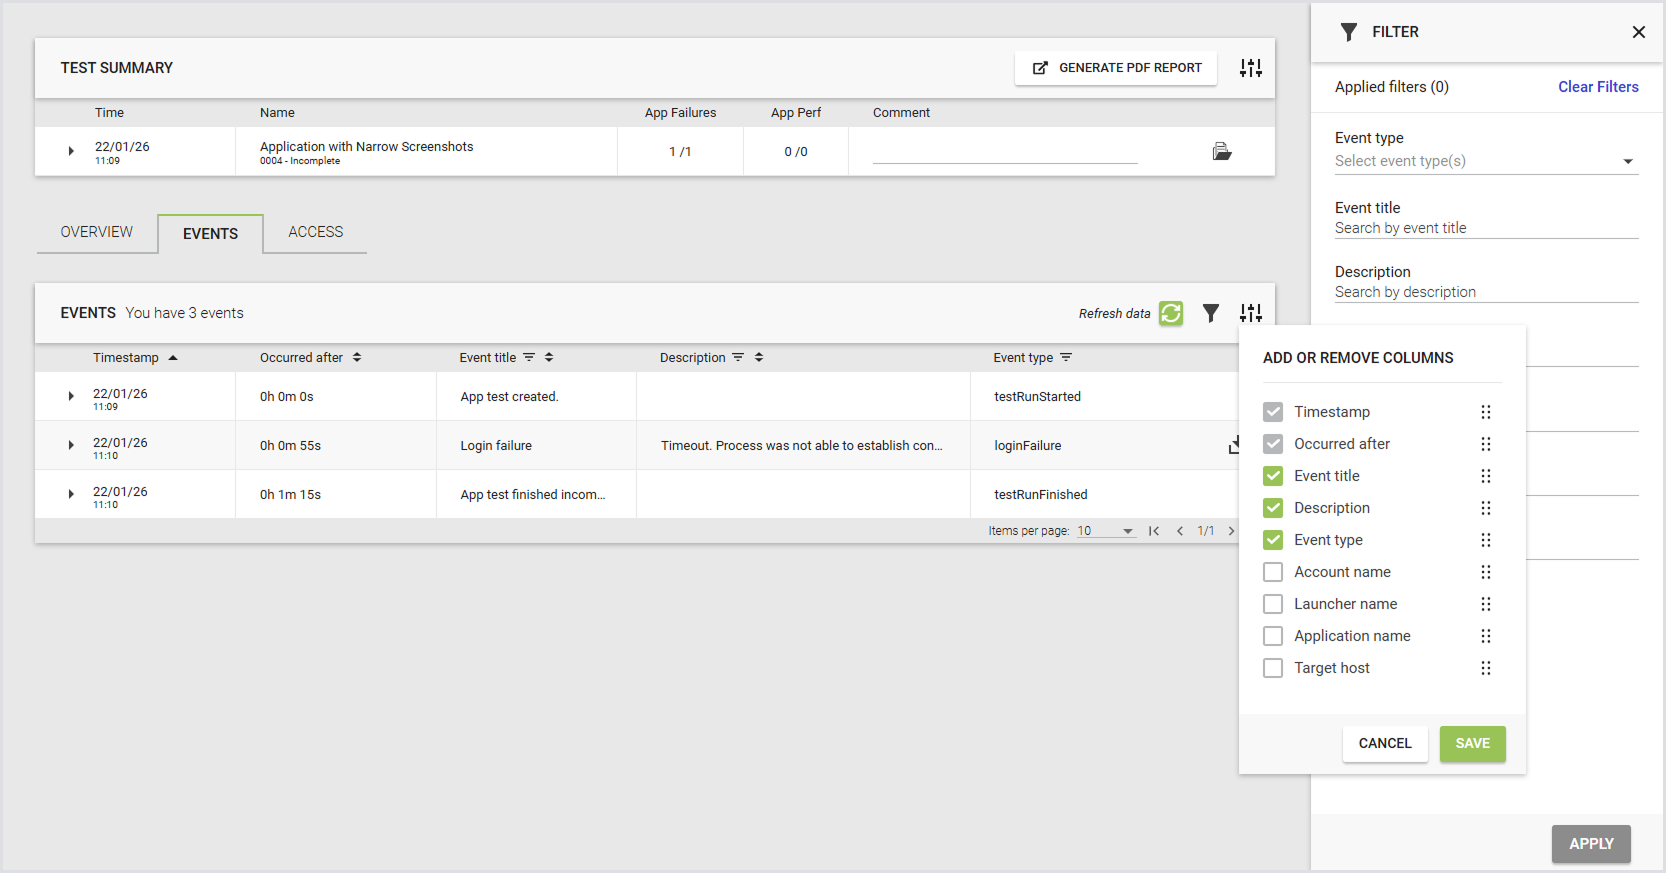
Events
The Events tab displays a table of key events across selected tests. The table includes the event date, time since test start, Test run name, and event title. Use this tab to identify patterns and troubleshoot issues, including when comparing tests.
Use the event filter on the Test run results page to refine results for single or compared Test runs. You can apply filters from:
-
The filter sidebar
-
Column headers
You can filter by:
-
Event title
-
Event type
-
Account name
-
Launcher name
-
Application name
-
Target host
Note: The Timespan and Occurred after columns always appear in the first and second positions and can't be removed or reordered.
Generating a Test PDF Report
You can generate and download a Test PDF report with the results comparing up to 5 Tests in one of the following ways:
-
Using the toolbar on the Application Test Results page:

-
Using the Generate PDF Report button on the Compare page:

Note: An Application Test report comparing multiple Tests is not generated automatically. You can generate the report manually using either the UI or the Public API.
Email notifications for this type of report aren’t supported.
Configuring a Test PDF Report
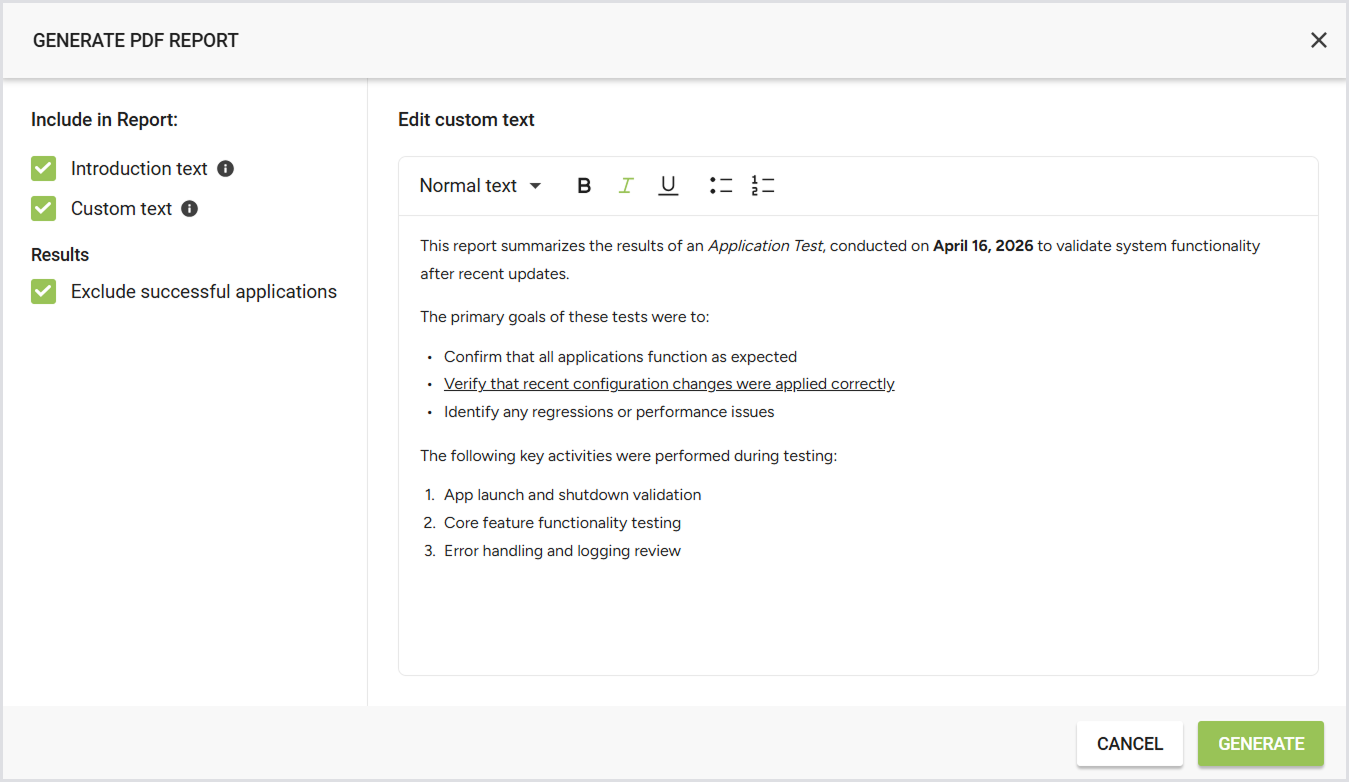
You can choose what you would like your Application Test PDF report to include. Once you click Generate PDF report, you can configure the following:
|
Setting |
Description |
Options / Details |
Notes |
|---|---|---|---|
|
Baseline test |
Select the test run to use as the baseline. |
- |
|
|
Introduction text |
Include general information about Login Enterprise at the beginning of the report. |
|
- |
|
Custom text |
Add your own text to the PDF report. Useful for describing what was tested, why, or summarizing conclusions. |
|
|
|
Results |
Exclude successful applications from the PDF report to keep it concise and focused on relevant information. |
|
|
A PDF report configuration with the results of a single Application Test looks as follows:
A PDF report configuration with the results of the compared Application Tests looks as follows:
Test PDF Report via the Public API
There are two types of Test PDF reports: old and new.
Old Test PDF report
-
Endpoint:
/publicApi/v8-preview/reports/{reportId}/pdf -
Automatically generated after each Test Run.
-
Available for single Application Test Runs only. Comparison reports are not supported.
New Test PDF report
-
Endpoint:
/publicApi/v8-preview/reports/application-test-runs/pdf -
Not saved automatically. You must generate it via the Public API.
-
Supports single and multiple Application Test Run IDs, allowing you to create comparison reports.
For more information, see Accessing the Public API.
Test PDF Report Breakdown
The Test PDF report summarizes the findings obtained from the testing process. It provides an overview of the Test specifics, results, and measurements. The report is divided into the following sections:
-
Introduction: Provides an overview of Application testing and the metrics used during this type of testing.
-
Test Specifics: Provides an overview of the key details of the test setup:
-
Product version: The Virtual Appliance version.
-
Connector: The specific Connector used for the Test.
-
Launcher group(s): The Group(s) of Launchers involved in the Test.
-
Test duration: The total duration of the Test.
-
Date: The date on which the Test was conducted.
-
Workload: The type of Workload or Test scenario used.
-
-
Test Summary: Highlights key metrics for the Test:
-
Application failure: Displays the number of failed Applications. For example: script failed to run.
-
Application performance: Shows the number of Applications where the actual time exceeded the performance threshold.
-
-
Platform Summary: Provides insights into the platform's performance based on latency and login performance:
-
Login performance: Indicates the performance during login operations.
-
Latency: This shows any latency issues that occurred during the Test.
-
Login Performance and Latency include the following:
-
Test name: The name of the Test conducted.
-
Bar chart: A visual representation of the performance data.
-
Actual time: The time taken for the specific Test.
-
Threshold: The predefined threshold, if applicable.
-
Execution: The result of the Test execution.
-
Performance: The performance analysis based on the Test outcome.
-
-
-
-
Application Results: Dives deeper into the results for each Application with the following subsections:
-
Summary: A high-level result of the Application's performance during the Test.
-
Measurements: Includes a table for each measurement or timer taken during the Test. Each table will include:
-
Test name: The name of the Test.
-
Bar chart: A visual representation of the performance data.
-
Actual time: The actual time recorded for the measurement.
-
Threshold: The threshold value (if applicable).
-
Status: The status of the Test.
-
Screenshots: This section includes screenshots taken on a particular application under test.
-
-
Tips and Tricks
Customizing Table Columns
You can customize the Test Results table by adding, hiding, or sorting columns.
-
Configuration icon: In the top-right corner of the Application Test results table, click the configuration icon to open the column management pop-up.

-
Adding columns: Add additional columns to the table. The following columns are available:
-
App Failures
-
App Performance
-
Comment
-
Test duration
-
Connector
-
-
Hiding columns: Hide columns you do not want to display using the configuration options.
-
Sorting columns: To sort columns, drag and drop them into your preferred order.
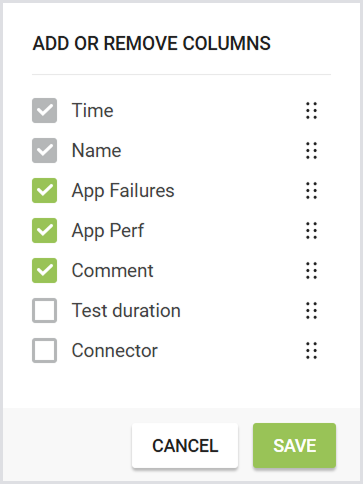
Note: The Time and Test Name columns are fixed and cannot be hidden or moved.
Your configuration settings are saved in your local storage, i.e., your column preferences will persist when you navigate away from the page or log out and back in.
The configuration may reset if you use a different browser or clear your browser history.
Additional Resources
-
For information on the Login performance, see Configuring Logon Components.
-
To learn about Latency, see Monitoring Latency.