Introduction
You can view the results of individual Load Tests and compare up to five Load Test instances. The Load Test Results page provides a comprehensive overview of measurements, including charts, graphs, and detailed events for each Test. You can also download both single and multiple Test results as PDF reports for easy sharing and analysis. See the instructions below for more details.
Single Test
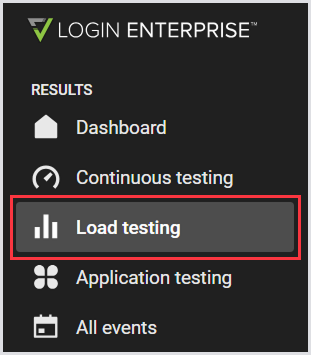
When a Load Test is completed, you can start looking at the results. To do this, in the Login Enterprise sidebar menu > Results, navigate to Load testing.
Single Test Summary
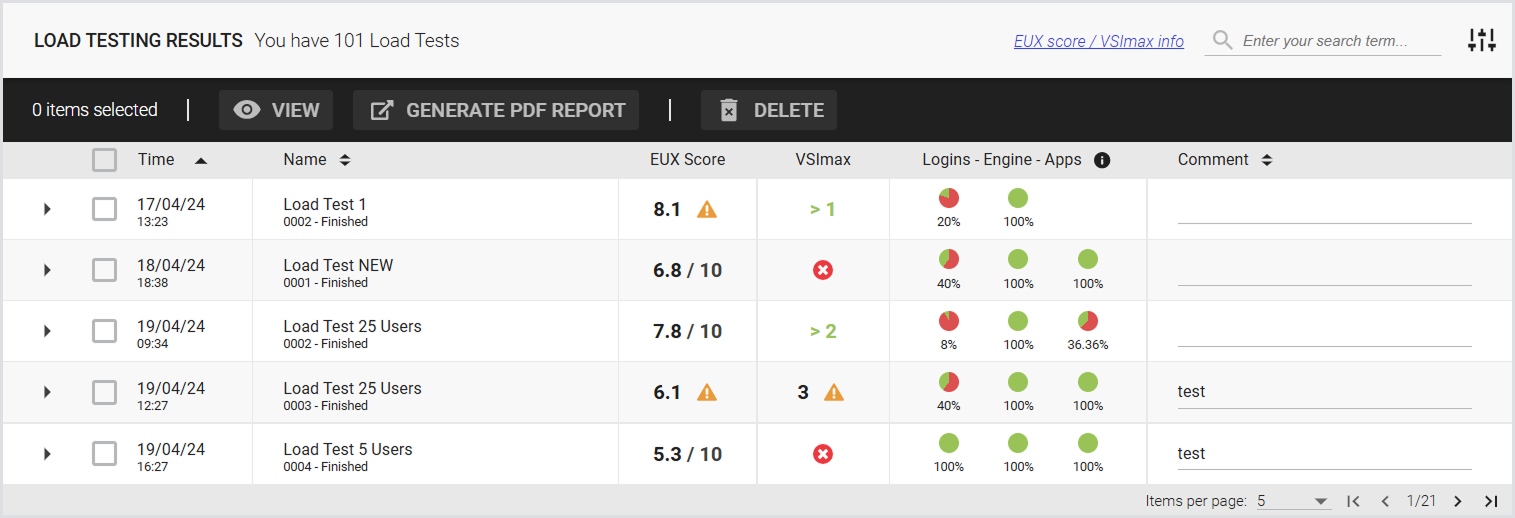
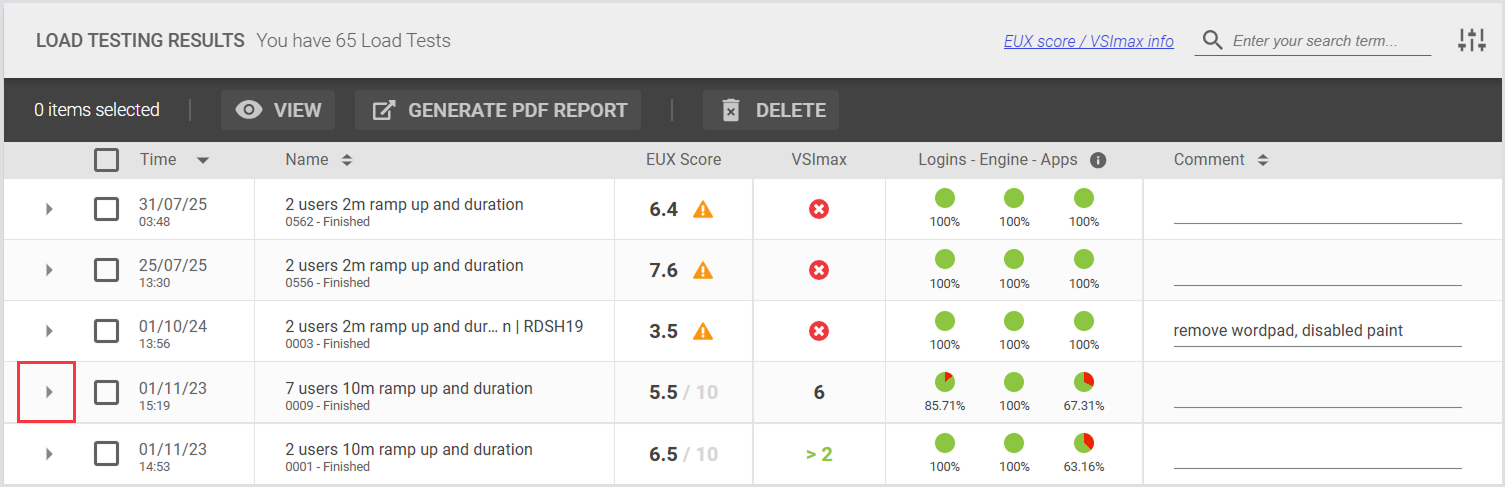
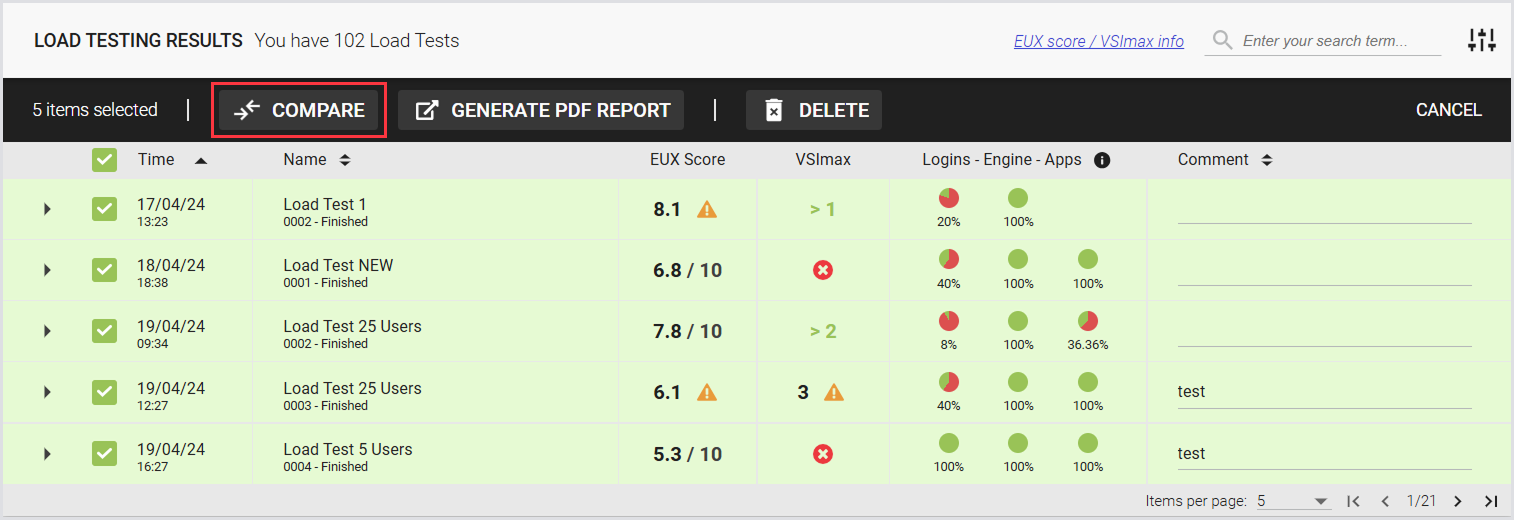
This page displays a list of previously executed Load Tests and includes the following:
|
Time |
Name |
EUX score |
VSImax |
Logins |
Engine |
Apps |
Comment |
|---|---|---|---|---|---|---|---|
|
Date and time of the Test. |
Name and sequence number of the Test. |
End User Experience score, i.e., a specific set of tools that produce measurements meant to closely approximate how a human would feel about using this machine. A score from 0 to 10. For details, see the EUX score. |
The maximum number of concurrent active VDI sessions your hardware will support without compromising responsiveness. For details, see the VSImax. |
Percentage of sessions that succeeded in logging in on the target environment. |
Percentage of sessions that succeeded in logging in on the target environment. |
Percentage of successfully executed Application scripts. |
The configured comment for the Test. |
Note: VSImax results are available only if the EUX score was enabled during the Load Test creation. If the EUX score is turned off, VSImax is automatically disabled and excluded from Test results (this includes single test results, compared test results, and PDF test reports).
To view the Test details, click on the Test you’re interested in:
For information on the EUX score and VSImax, see Calculating the EUX score and VSImax.
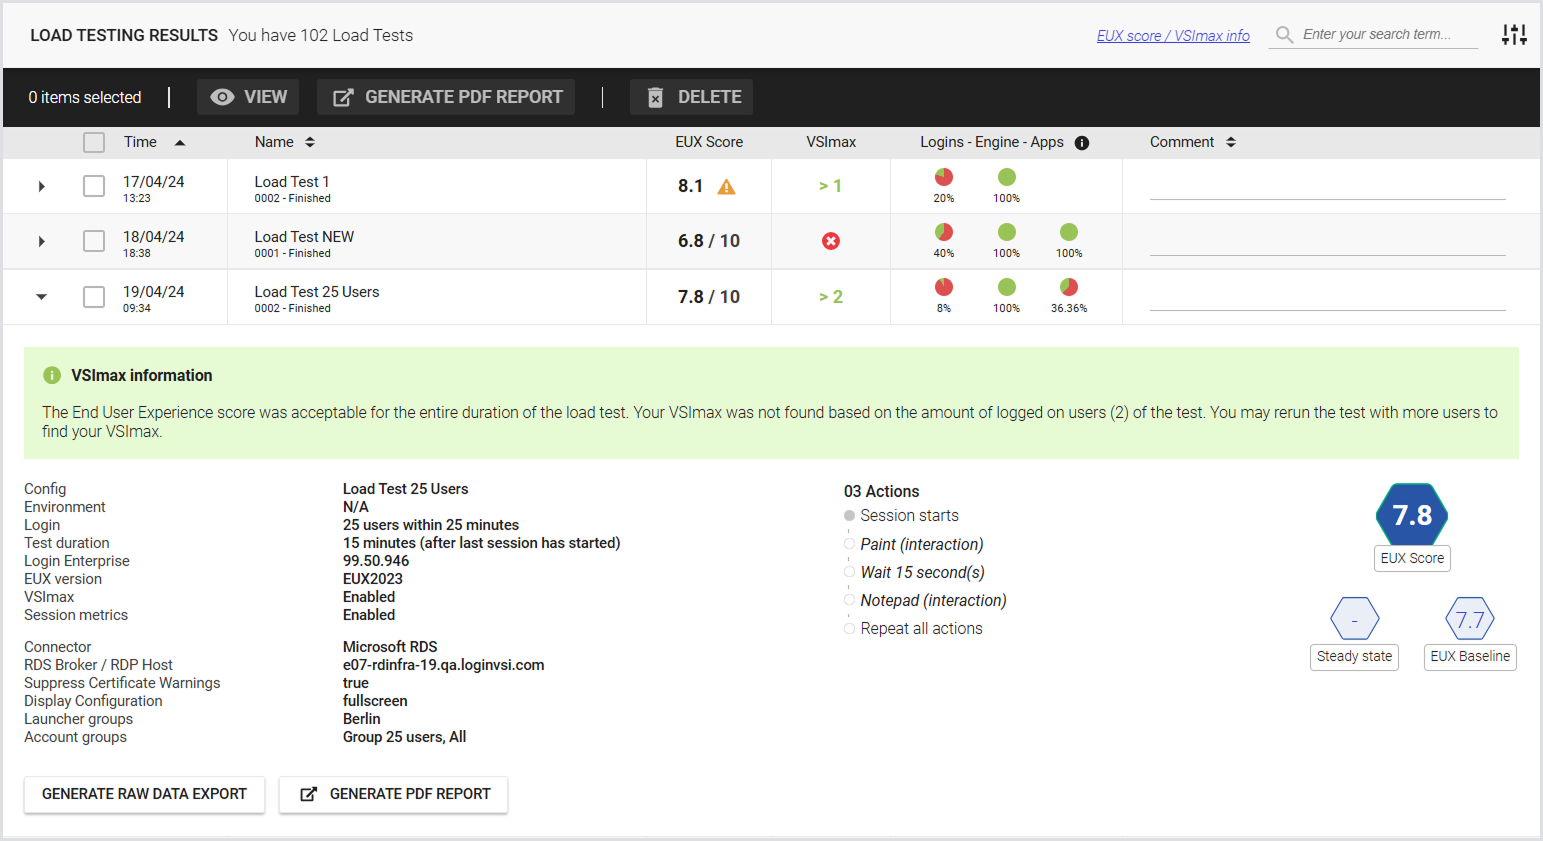
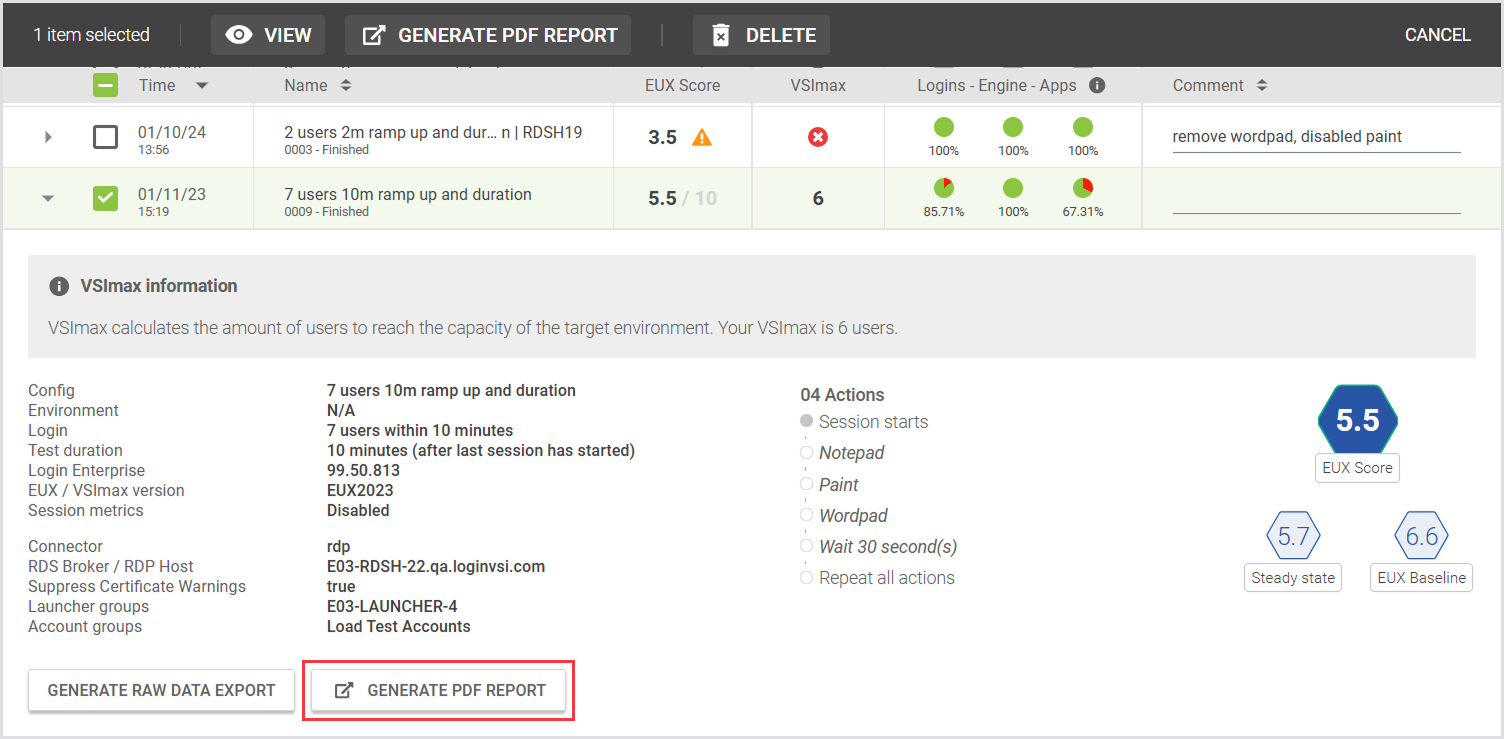
Single Test Results
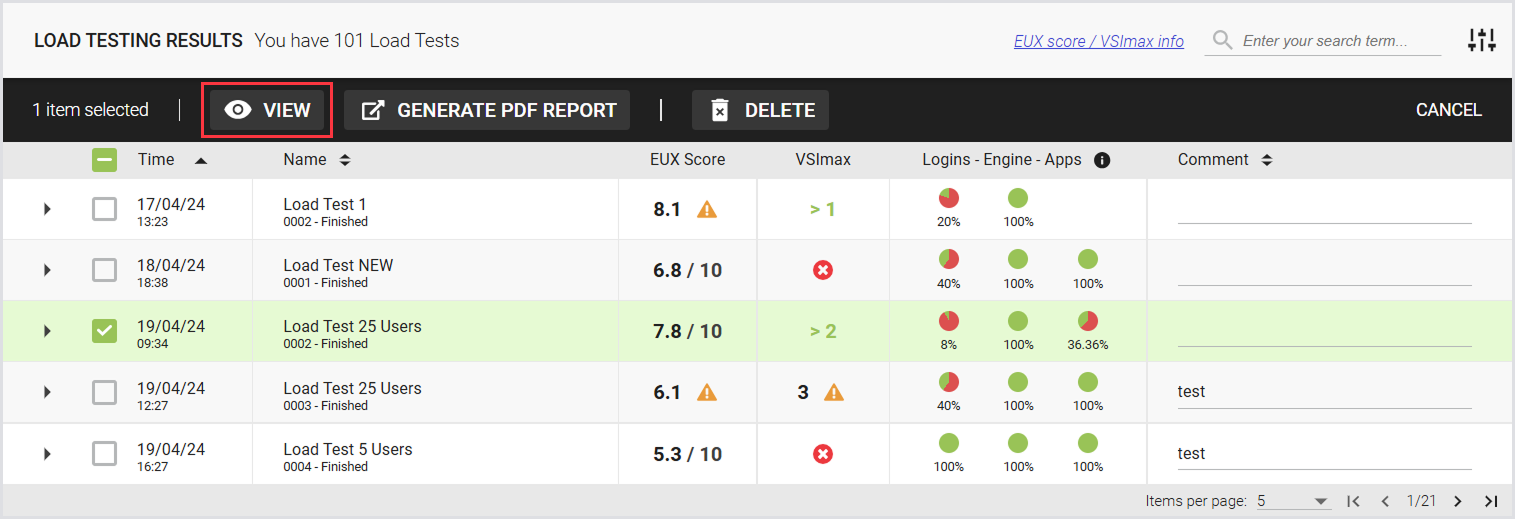
To view the test results for a single test, select a test and click View.
The following page displays the compare Test summary, Overview (EUX Score/VSImax, Login Time, and Application Response Time), Charts, Events, and Access. For details, see the Test Results.
Auto Refresh
The page will automatically refresh every minute while a Load Test is running. This feature is available only in the single Load Test view and not in the Compared Tests views.
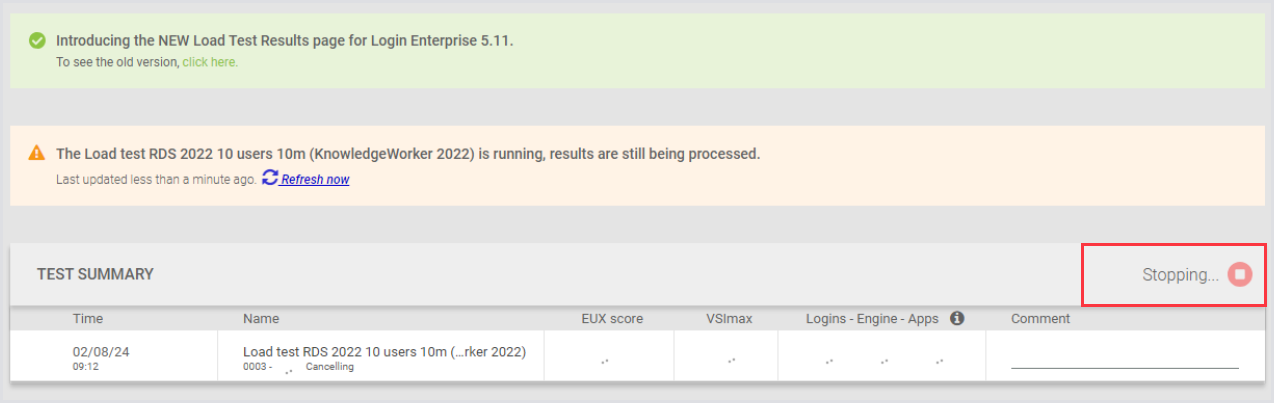
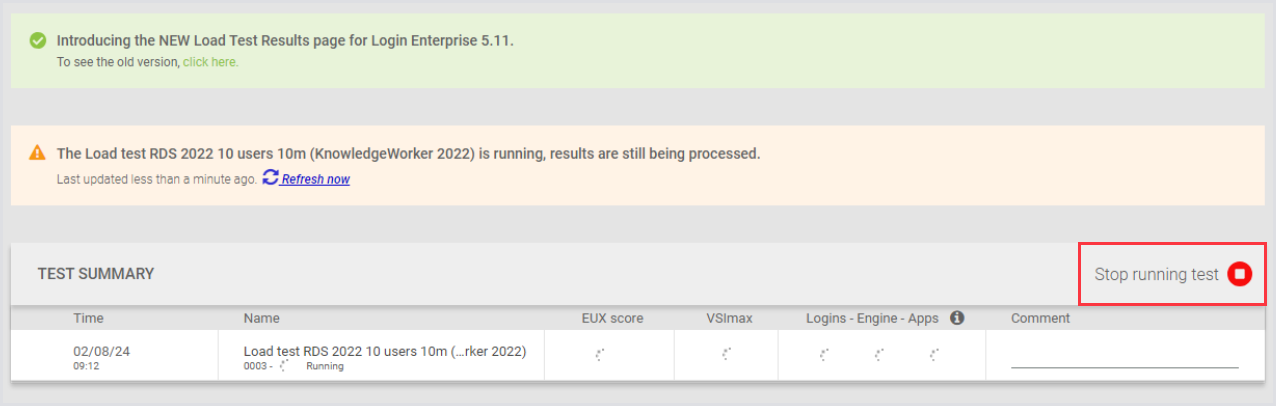
Stopping the Test
You can stop a Load Test directly from the Results page, provided the Test is still running. This option is available only for single Load Tests. To stop the Load Test, click Stop Running Test. The screenshot below highlights the button to help you locate it easily.
Generating a Test PDF Report
Generate a single Test PDF report manually or using the Public API. To generate the report:
-
In the Load Testing results, click on the Test you’re interested in.
-
Click Generate PDF report (A browser pop-up will open).
Tip: Alternatively, select the checkbox next to the specific Test, and in the top menu toolbar, click Generate PDF report.
-
Click Generate PDF report (A browser pop-up will open).
-
In the Generate PDF report pop-up, configure the report according to your needs by ticking off the info you want to include. For details and examples, see Configuring a Test PDF Report.
-
Click Generate, and then Save.
Tip: Alternatively, select the checkbox next to the specific Test, and in the top menu toolbar, click Generate PDF report.
Two Load Tests
Quick Results View
When you compare 2 Load Tests, you’ll see a banner with quick results. The banner includes the same measurements as the Compared Test Results.
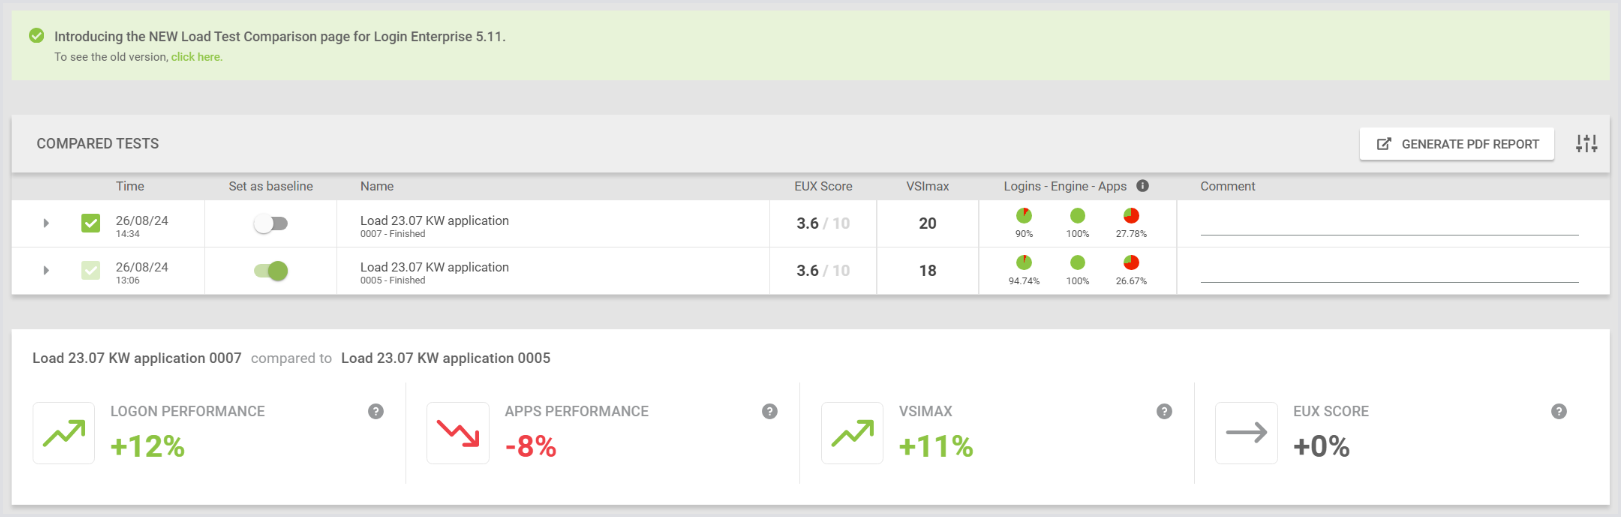
Compared Tests
To view the test results for the compared tests, select up to 5 tests and click Compare.
The following page displays the compare Test summary, Overview (EUX Score/VSImax, Login Time, and Application Response Time), Charts, and Events.
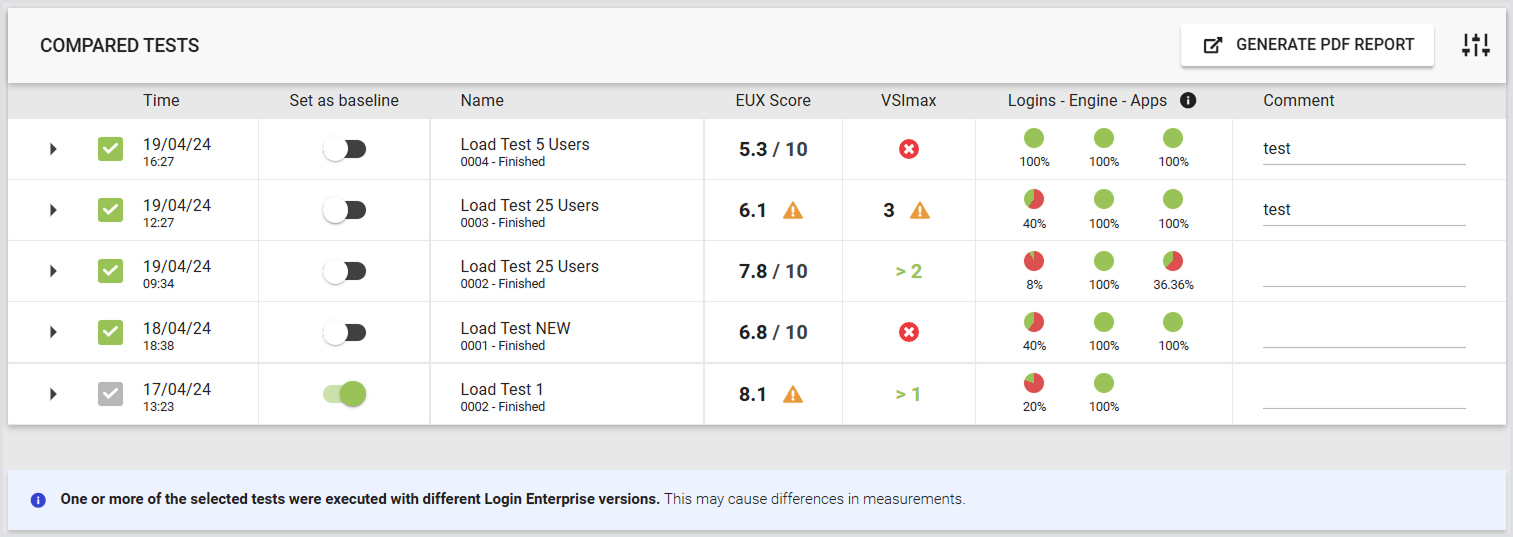
Compared Test Summary
-
Displays all selected Tests with an option to designate one Test as the baseline.
-
The selected Tests are compared against the Baseline Test.
-
By default, the oldest Test is set as the baseline.
-
Tests are sorted by date, with the oldest at the bottom and the newest at the top.
-
In the comparison tables, columns are sorted by date from left (oldest) to right (newest).
-
Baseline Test results are highlighted in green in the header.
-
If you change the baseline Test, the highlighting and the percentage differences will update accordingly, but the sorting will remain unchanged.
Note: You can include or exclude a Test from the comparison without needing to go back a step. For this, unselect the preferred Test on the Results page. The Test will be removed from the comparison and will not appear in the PDF report if generated.
You cannot deselect the Baseline Test. You cannot set a deselected Test as the Baseline.
Compared Test Results
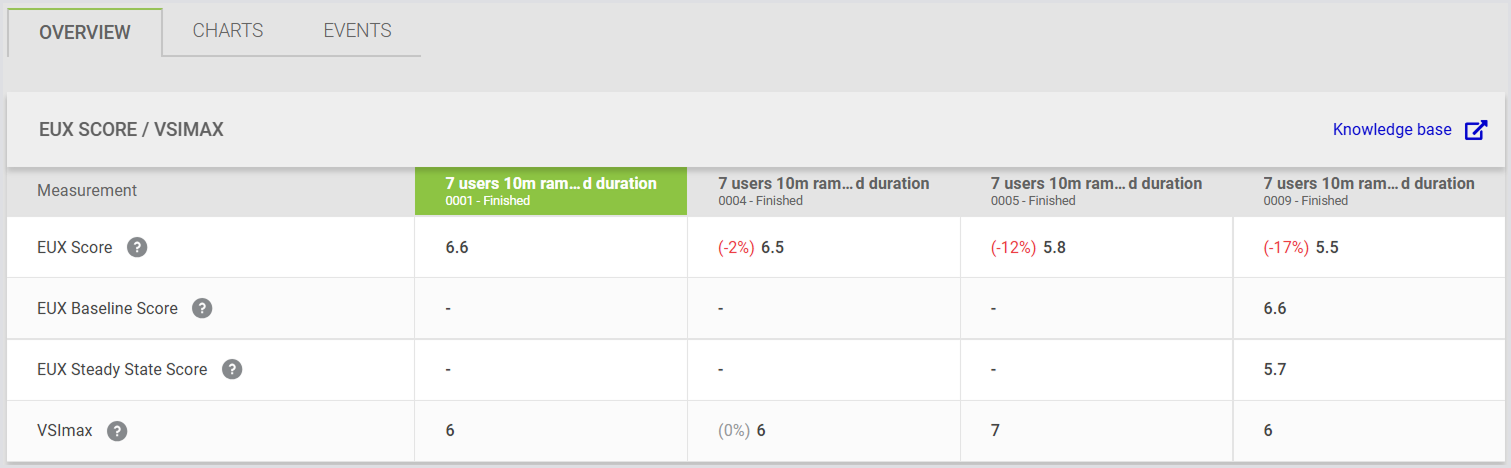
EUX Score and VSImax
This is where you can see the results of all Tests, even if the comparison isn’t possible, e.g., missing data in the Baseline Test.
Note: When comparison isn't possible, values are shown without percentage differences.
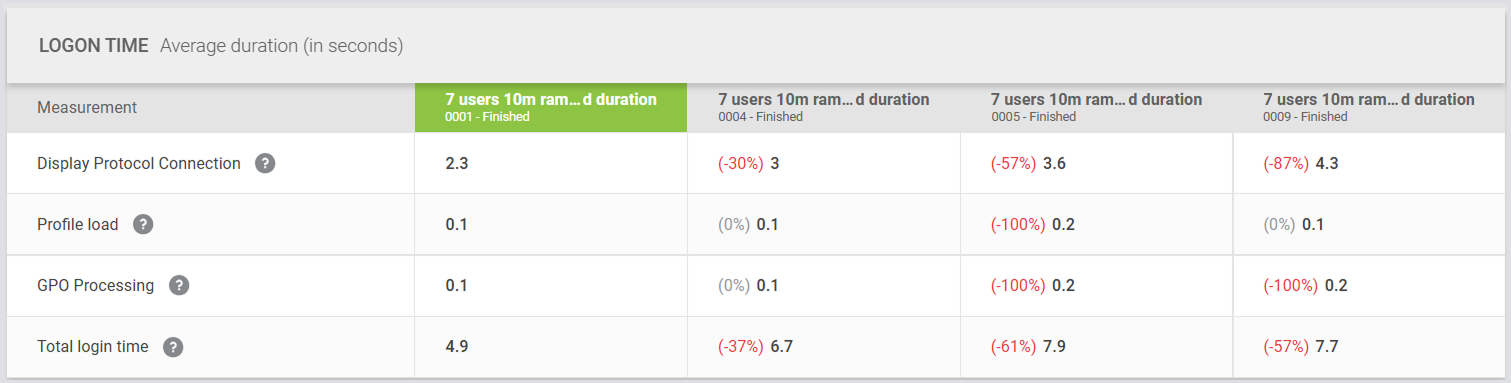
Logon Time
This is where you can see various stages and metrics associated with a user's login process on a Windows-based system. Here’s a breakdown of what each metric measures:
-
Display protocol connection: Measures the time from when the launcher starts the session to when profile loading begins. This metric is found in Windows Event Logs.
-
Profile load: Measured using User Profile events from the Windows Event Viewer.
-
GPO processing: Only measures synchronous group policies. Asynchronous ones have minimal impact on user experience and are therefore not measured.
-
Total login time: Measures how quickly a user account can log in, load the user profile, and become fully interactive.
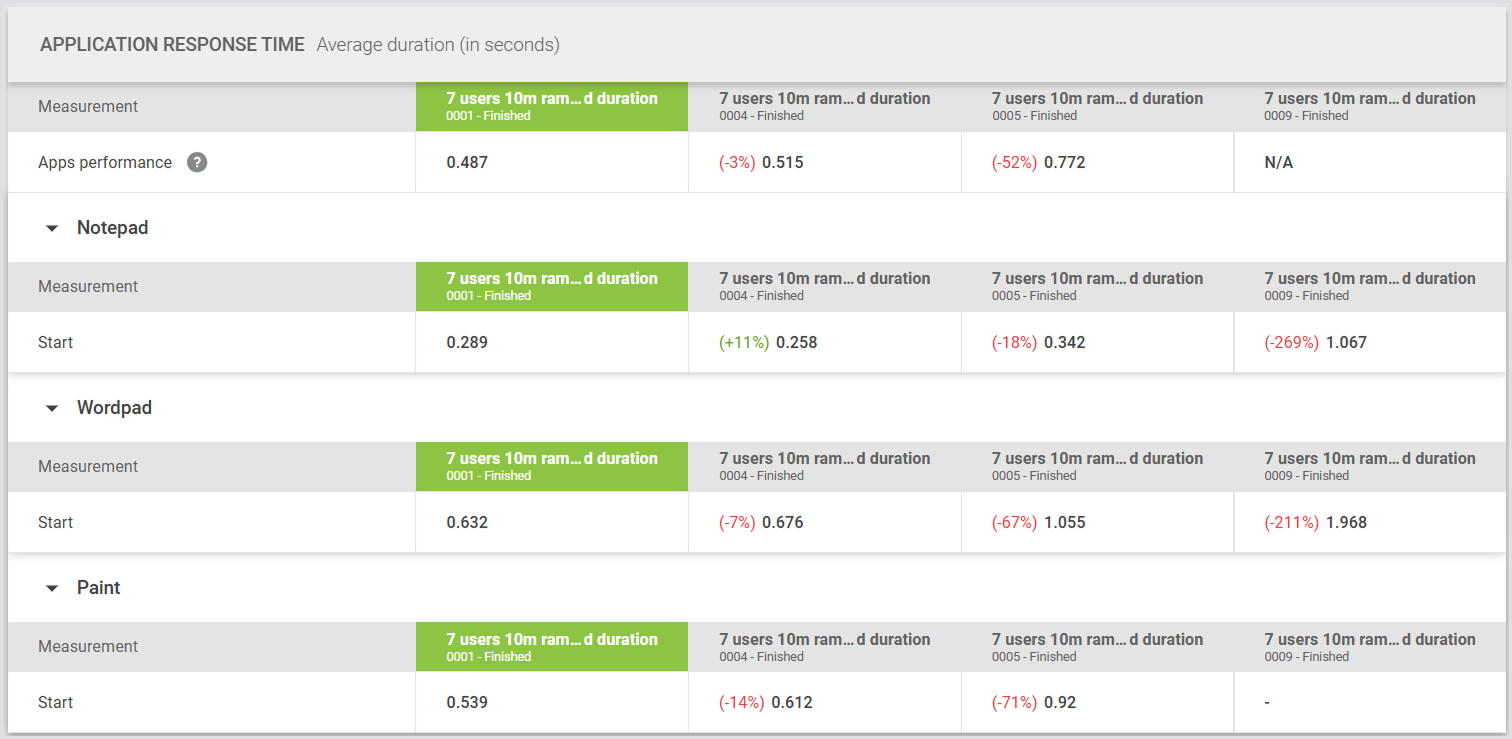
Application Response Time
-
The first row always shows the "Apps Performance" value based on the average response times of all Baseline Applications.
-
The "Apps Performance" value is shown only if the Test includes all Applications and measurements present in the Baseline.
-
The average response time is calculated solely for the Baseline Applications and measurements, excluding any additional ones.
-
Tests that do not include all the Baseline Applications and measurements will not have a value in the "Apps Performance" field.
-
Results per Application are displayed below the total.
-
Only Applications present in the Baseline Test are shown.
-
If you switch the Baseline Test, the Applications shown will be updated accordingly.
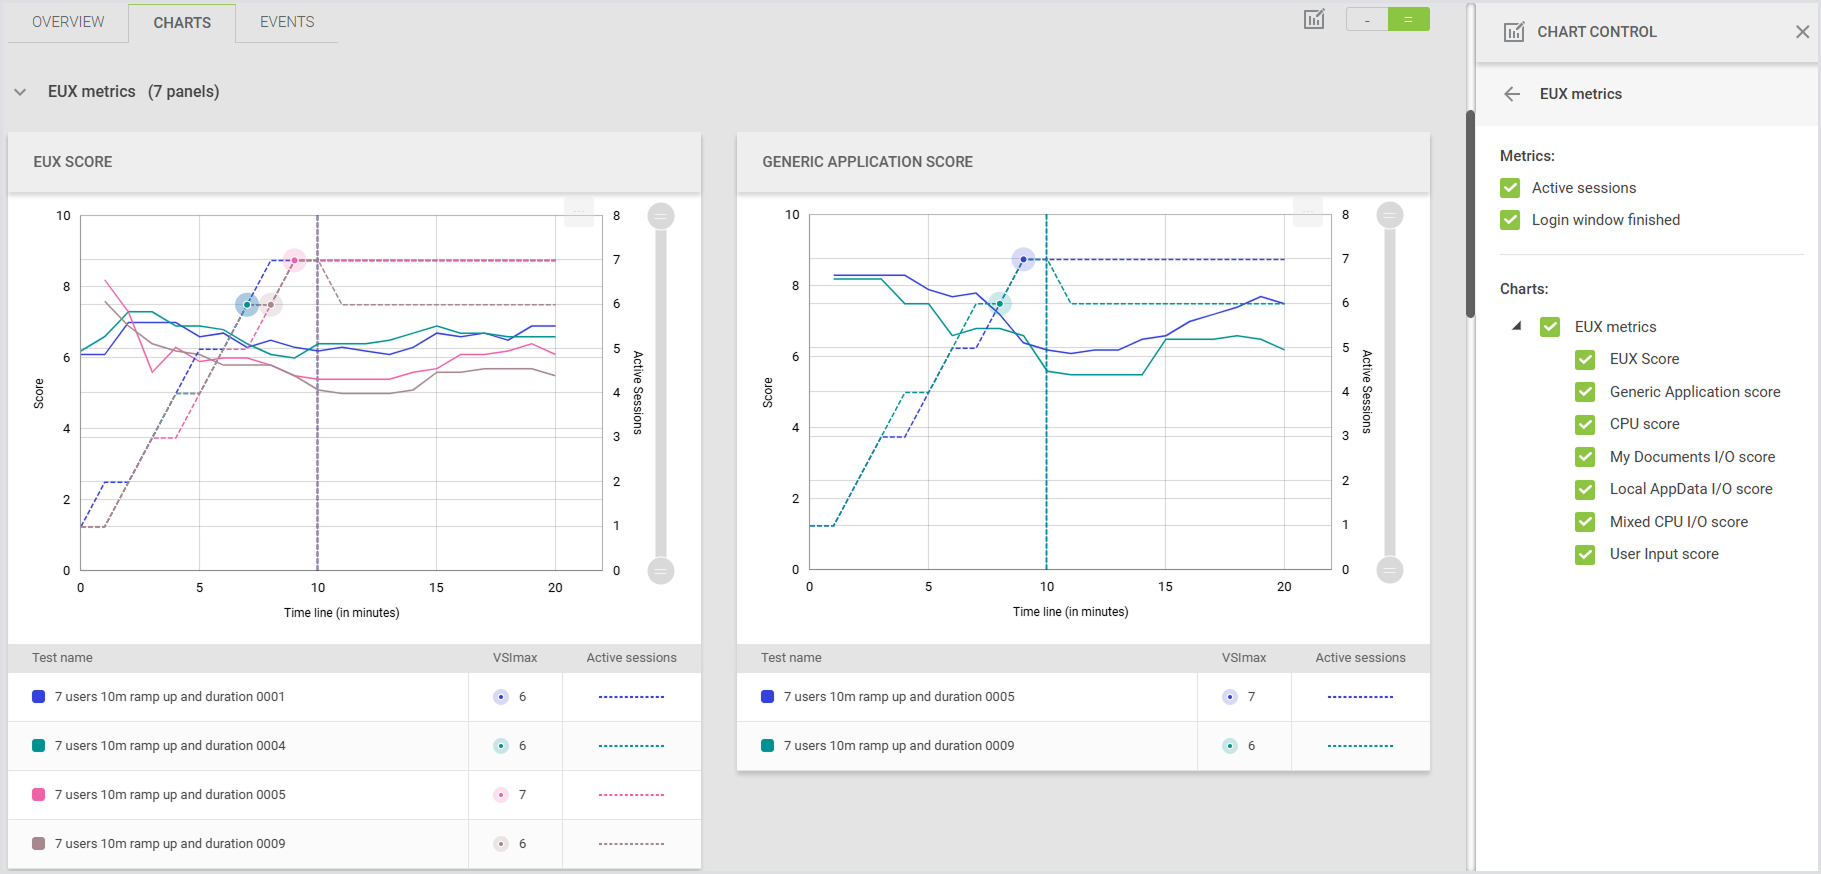
Charts
This is where you can see and interact with charts and graphs displaying the EUX Metrics, Logon Time, Application Response Time, and Session Metrics.
Charts include a tree structure that lets you expand or collapse metric groups and select or deselect multiple items at once. This applies to both single Load Tests and comparisons, and helps streamline the selection of complex measurement categories such as application response times, session metrics, and platform metrics.
Note: The Display options section is only available in single Load Test views. It does not appear in the Compared Test views.
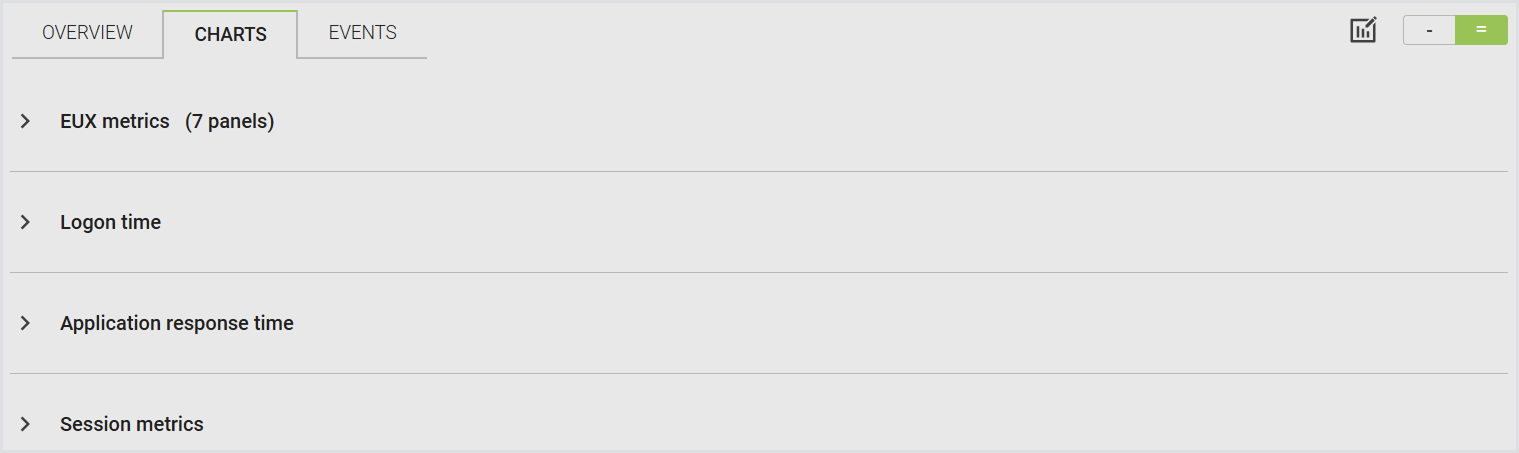
Tip: You can interact with the Charts in different ways using the Chart Control. For more information, see the Chart Control.
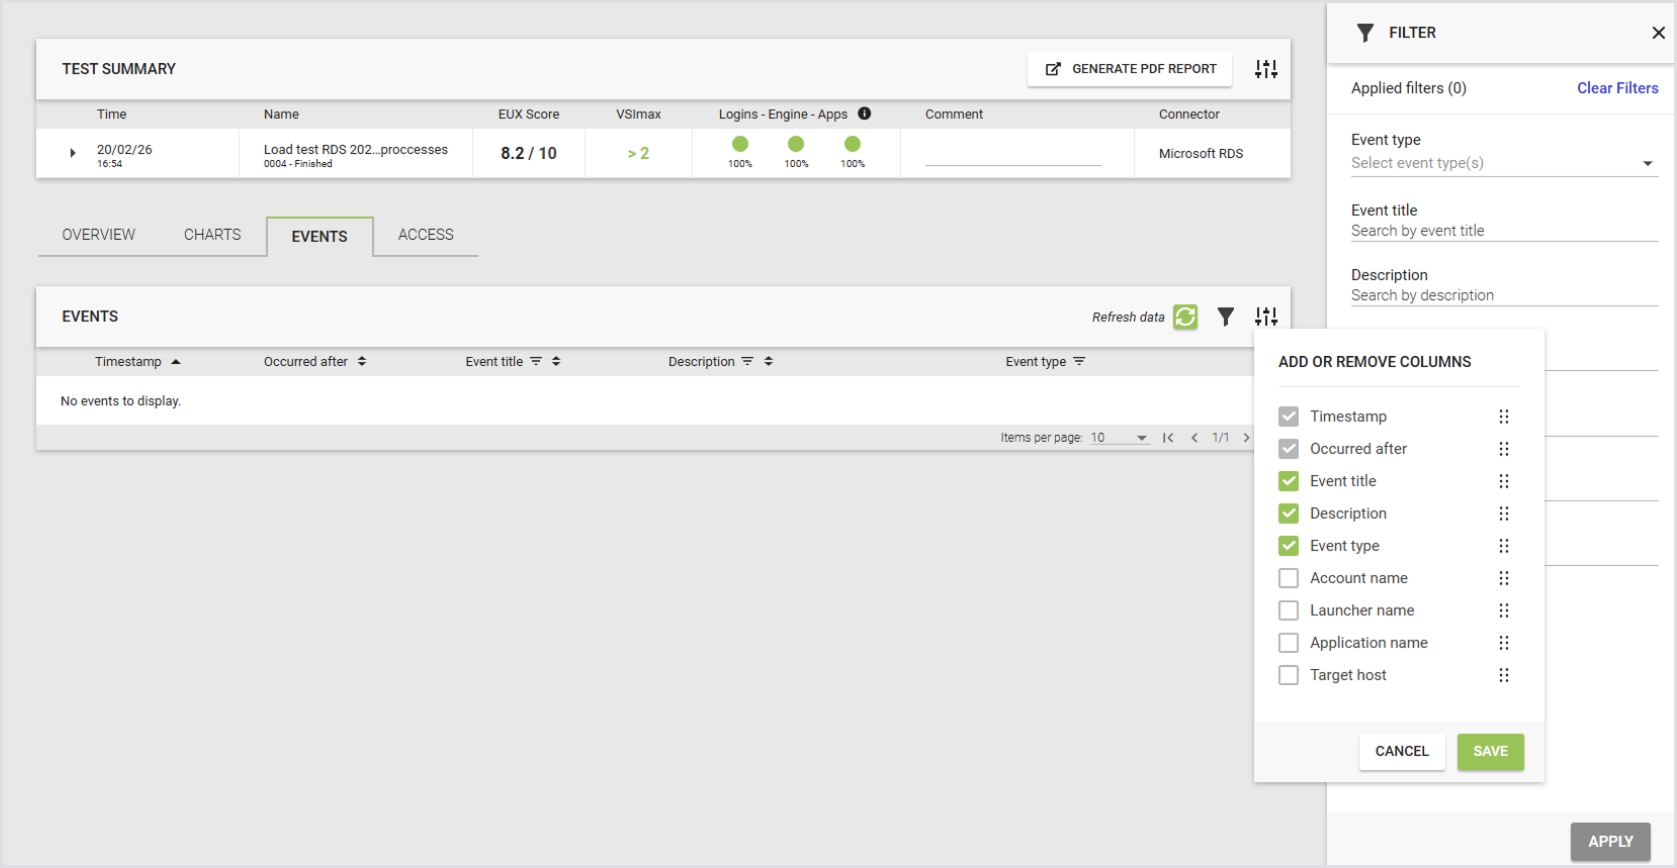
Events
The Events tab displays a table of key events across selected Load Tests. Use this tab to identify patterns and troubleshoot issues, including when comparing Load Tests. The table includes the event date, time since test start, Test run name, and event title. You can filter results to show specific tests or event details.
Use the event filter on the Test run results page to refine results for single or compared Test runs. You can apply filters from:
-
The filter sidebar
-
Column headers
You can filter by:
-
Event title
-
Event type
-
Account name
-
Launcher name
-
Application name
-
Target host
Note: The Timespan and Occurred after columns always appear in the first and second positions and can't be removed or reordered.
Generating a Test PDF Report
You can generate and download a PDF report with the results comparing up to 5 Load Tests in one of the following ways:
-
Using the toolbar on the Load Test Results page:

-
Using the Generate PDF Report button on the Compare page:
Configuring a Test PDF Report
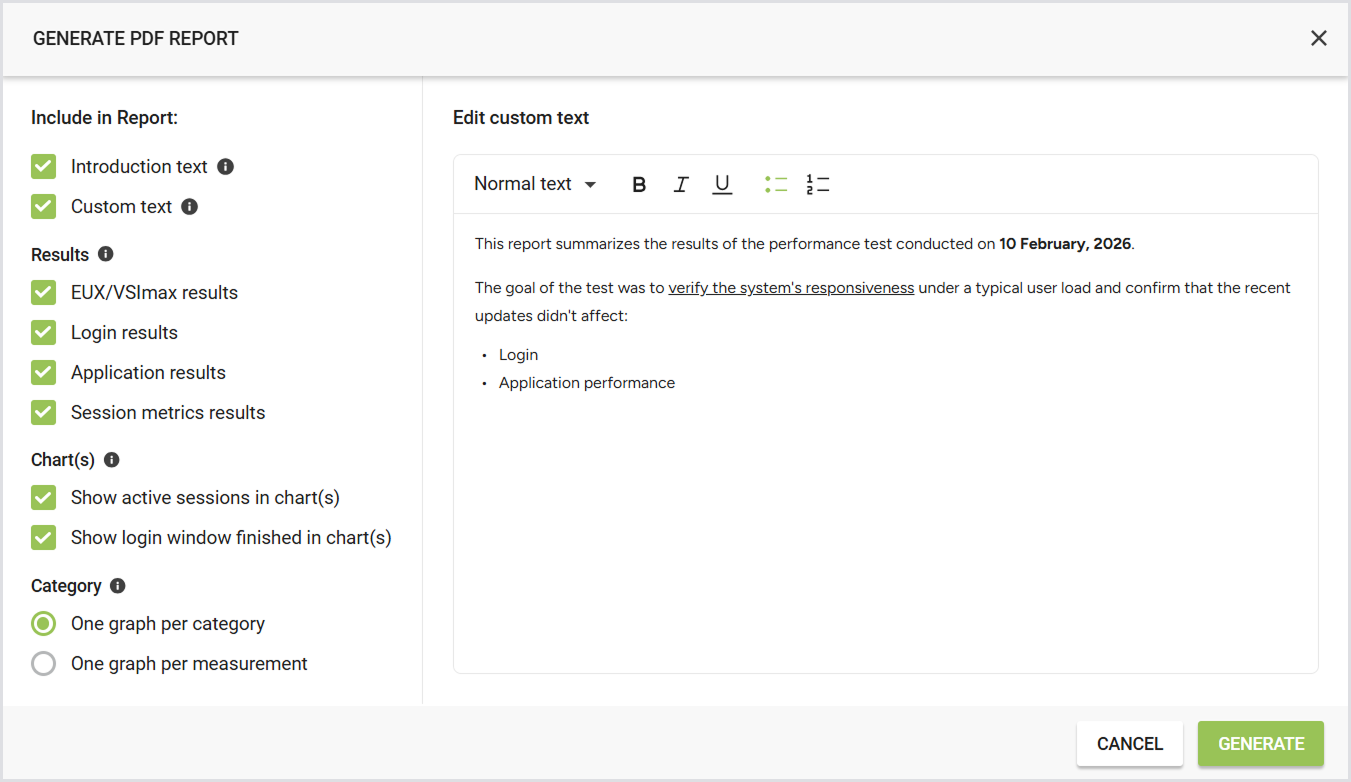
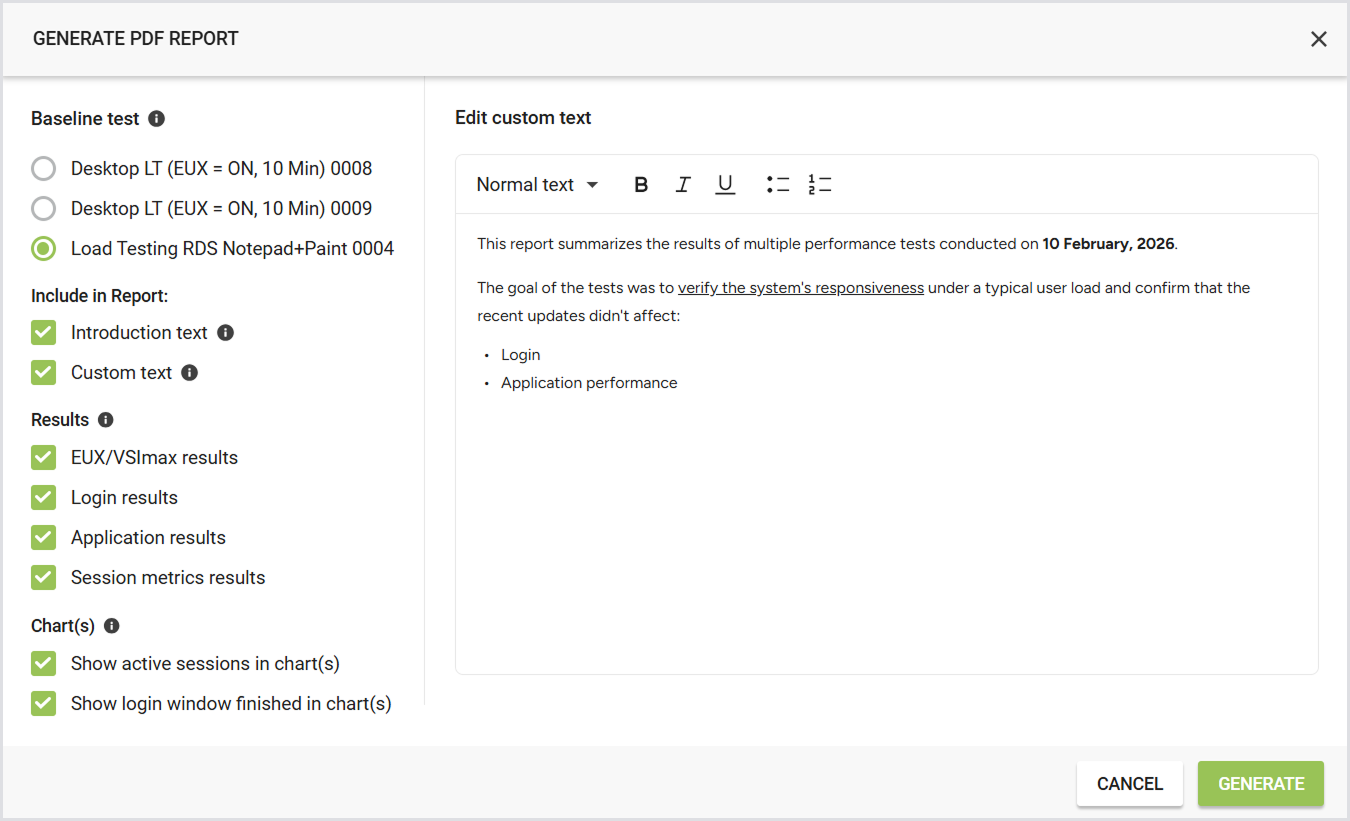
You can choose what you would like your Load Test PDF report to include. Once you click Generate PDF report, you can configure the following:
|
Setting |
Description |
Options / Details |
Notes |
|---|---|---|---|
|
Baseline test |
Select the test run to use as the baseline.
|
— |
|
|
Introduction text |
Include general information about Login Enterprise at the beginning of the report. |
|
— |
|
Custom text |
Add your own text to the PDF report. Useful for describing what was tested, why, or summarizing conclusions. |
|
|
|
Results |
Choose which test results to include or exclude. |
Available result types:
|
— |
|
Charts |
Configure what graphical data to include in the report. |
|
— |
|
Category |
Define how measurement data is grouped in charts. This does not apply to session metrics. |
|
|
A PDF report configuration with the results of a single Load Test looks as follows:
A PDF report configuration with the results of the compared Load Tests looks as follows:
Test PDF Report via the Public API
You can download the Load Test PDF report via the Public API using the following endpoint: /publicApi/v7/reports/load-test-runs/pdf. For more information, see Accessing the Public API.
Test PDF Report Breakdown
The Test PDF report summarizes the findings obtained from the testing process. It provides an overview of the Test specifics, results, and measurements. The report is divided into the following sections:
-
General information: Including Introduction, EUX score, and Metrics.
-
Test specifics: Such as the product version, EUX version, VSImax version, Connector, Launcher group, number of users, Login window, Test duration, Date, and Workload.
-
Test results: all the results, such as Success rates (table), EUX score (table), and VSImax (table).
-
Charts: Including the EUX score, EUX timers, and Login-specific charts with Display protocol connection, Profile load, GPO processing, and Total login time.
-
Application-specific charts: Depending on the scripts/workloads attached to the Test, the report will contain a chart for each timer.
-
Application response time table: For single Load Tests, a table lists the average response time for each timer. This provides a summary of application performance not directly shown in the charts.
-
Session Metrics charts: Depending on the Session Metrics linked to the Test, each session metric will have its own chart.
Note: When comparing Tests, if an application is present in the Baseline Test but missing in a compared test, the corresponding measurement lines (Active Sessions, Login Window Finished) are not displayed in the PDF chart. The test is also excluded from the chart legend.
Active sessions and login window finished:
-
In a single Load Test PDF report, all charts will include lines for active sessions and the login window finished line.
-
In a PDF report comparing two Load Tests, all charts will include lines for active sessions, but none will include the login window finished line.
Comparing logic:
-
The report will determine which Test is compared to which, mirroring the UI. To switch the Tests in the report, switch them in the UI first, then generate the PDF report.
-
The Test considered as the Baseline will be labeled "Baseline" in tables.
EUX & VSImax-related messages
The EUX and VSImax information, warning, and error messages are shown in the comment column within their respective tables.
Export Data
Exporting data for Load Tests follows the same procedure as Continuous Tests. For detailed steps, see the Continuous Testing Results section.
EUX Raw Data
Similarly, refer to the Continuous Testing Results section.
Tips and Tricks
Customizing Table Columns
You can customize the Test Results table by adding, hiding, or sorting columns.
-
Configuration icon: In the top right corner of the Load Test Results table, click the configuration icon to open the column management pop-up.

-
Adding columns: Add additional columns to the table. The following columns are available:
-
Connector (Type)
-
Login Window
-
# of Users
-
Test Duration
-
EUX Steady State
-
EUX Baseline
-
-
Hiding columns: Hide columns you do not want to display using the configuration options.
-
Sorting columns: To sort columns, drag and drop them into your preferred order.
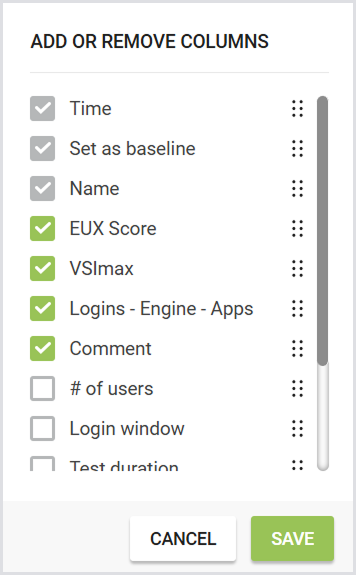
Note: The Time, Set as Baseline, and Test Name columns are fixed and cannot be hidden or moved.
Your configuration settings are saved in your local storage, i.e., your column preferences will persist when you navigate away from the page or log out and back in.
The configuration may reset if you use a different browser or clear your browser history.
Chart Legends with a Table
For a single Load Test, the chart legend is displayed in a table format:
-
Chart Legend Table: Column 1 shows the Test name.
-
Active Sessions and VSImax Indicators: Appear between the chart and the table. When the active sessions line is disabled, the associated icons are hidden.
-
Highlighting Table Rows: Highlights the corresponding line on the chart and fades the others. The selected row is greyscaled.
-
Active Sessions Line: Shown as a blue dotted line, replacing the previous green line.
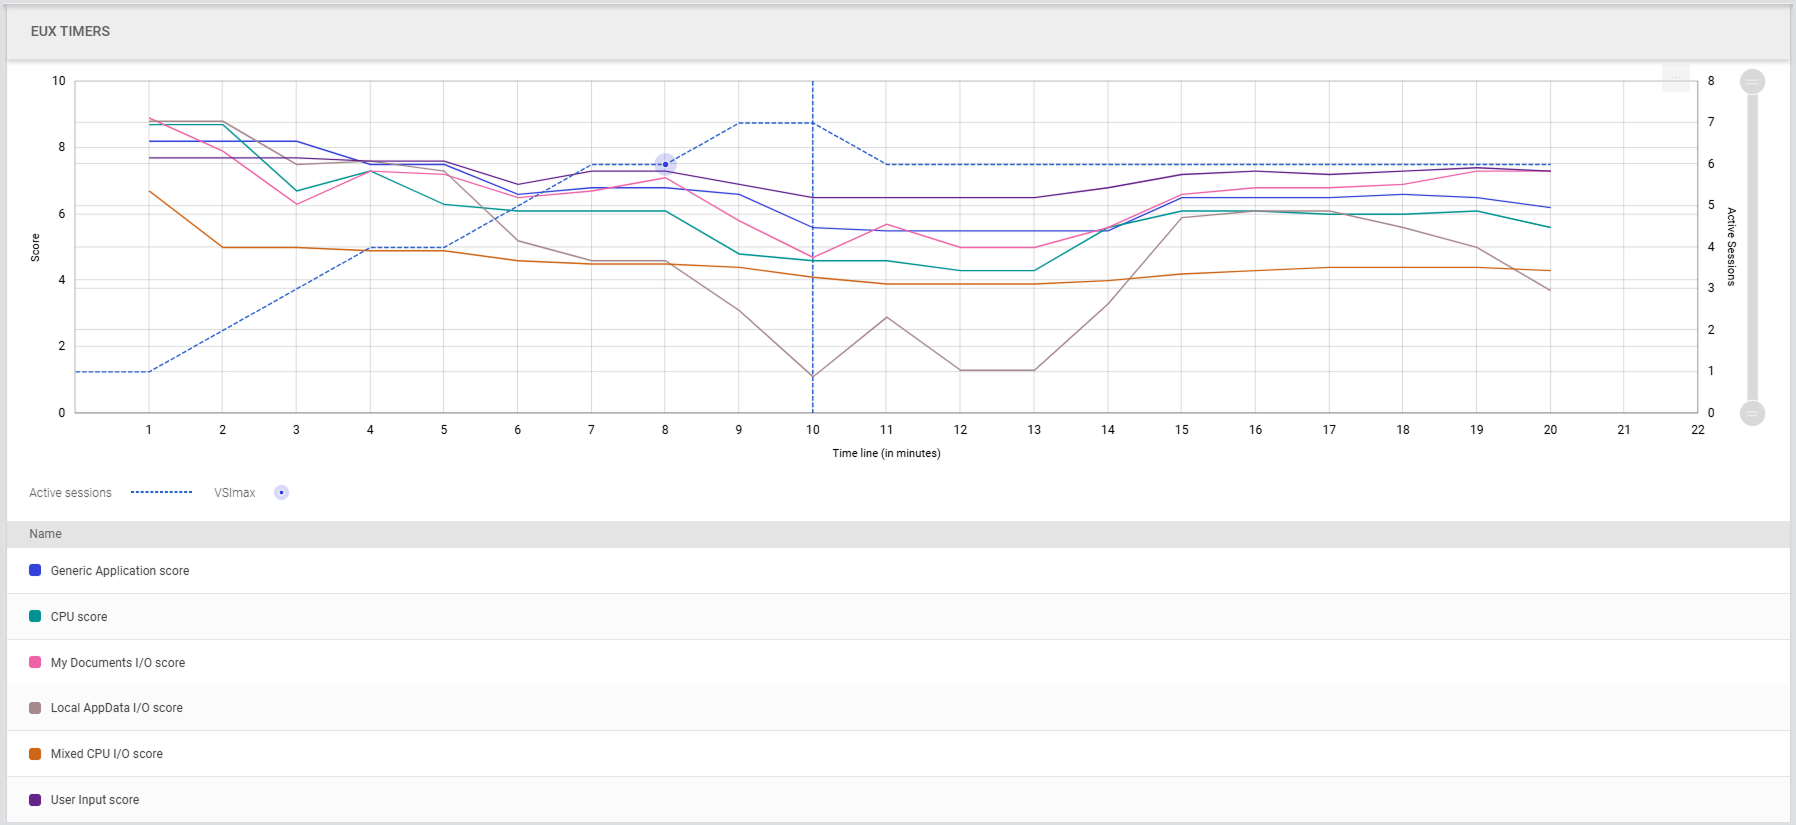
Note: In the Single Test view, the chart table does not appear when the chart contains only one result. This could be the case with the EUX chart or when selecting one chart per measurement.
In the Test Compare view, the table is always displayed, even if the graph contains only one result for one of the Tests.
For the compared Load Tests, the chart legend is also displayed in a table:
-
Chart Legend Table:
-
Column 1: Test name
-
Column 2: VSImax value (if applicable)
-
Column 3: Active sessions (dotted line matching the measurement line color)
-
-
Disabling Active Sessions: Hides the Active Sessions and VSImax columns.
-
Highlighting Table Rows: Highlights the corresponding line on the chart, fading others. The selected row is greyscaled. The following lines are highlighted:
-
Measurement line
-
Active sessions line (including Login Window Finished)
-
VSImax (if available)
-
-
Active Sessions Line: Shown as a dotted line matching the measurement line color.
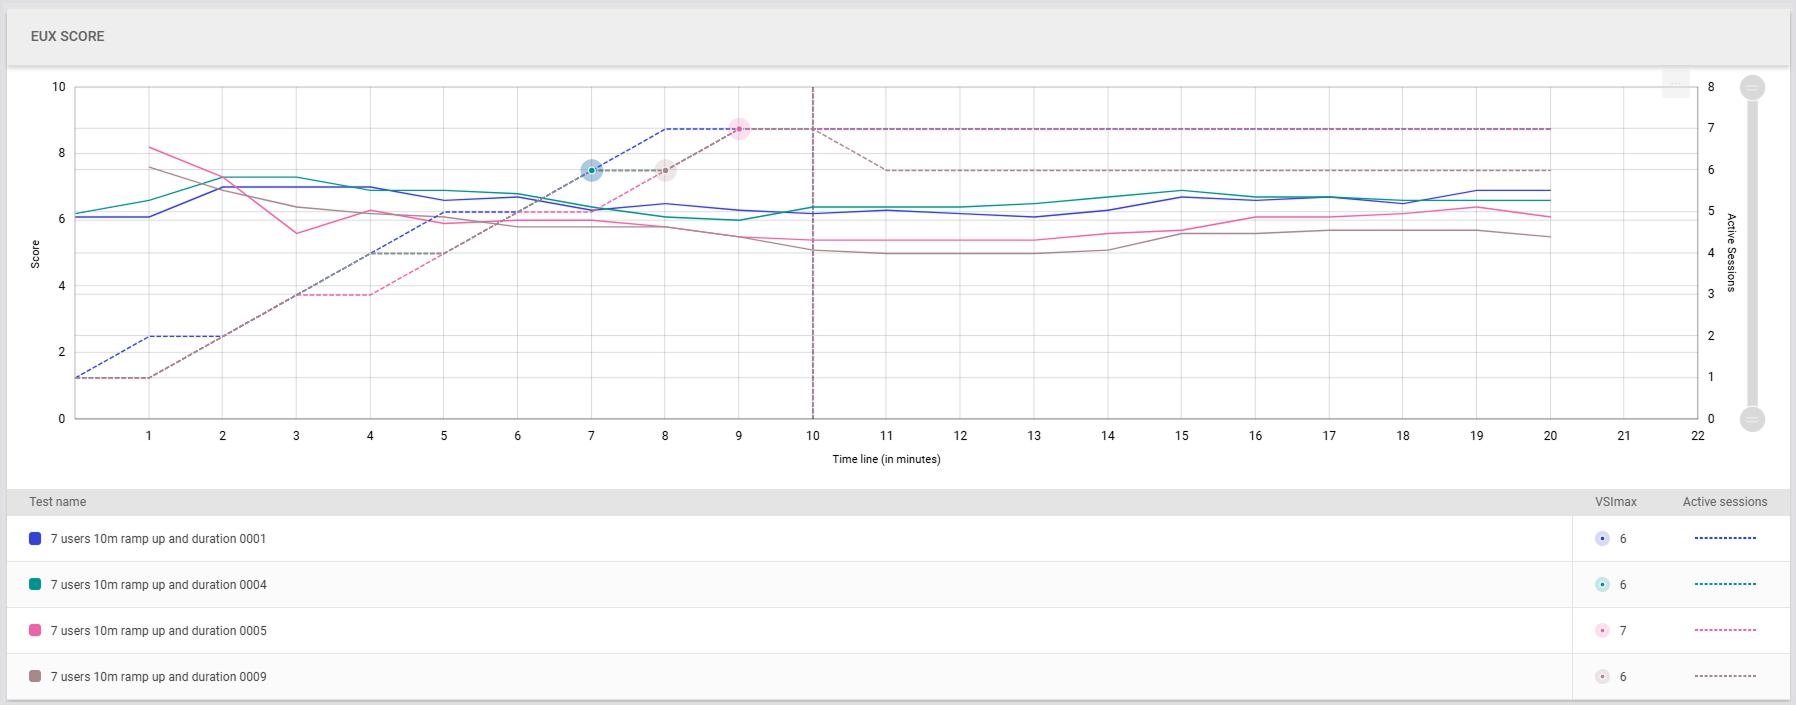
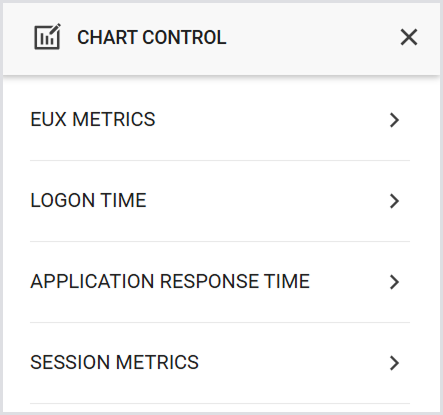
Chart Control
You can choose from 4 data sources for your charts:
-
EUX Metrics: Built-in EUX measurements.
-
Logon Time: Login phase times.
-
Application Response Time: Timers from your Application scripts.
-
Session Metrics: Custom-configured session metric data.
For the EUX Metrics, Logon Time, and Application Response Time, you can switch between 2 ways of presenting data:
-
One graph per category: Displays each measurement in a separate graph:
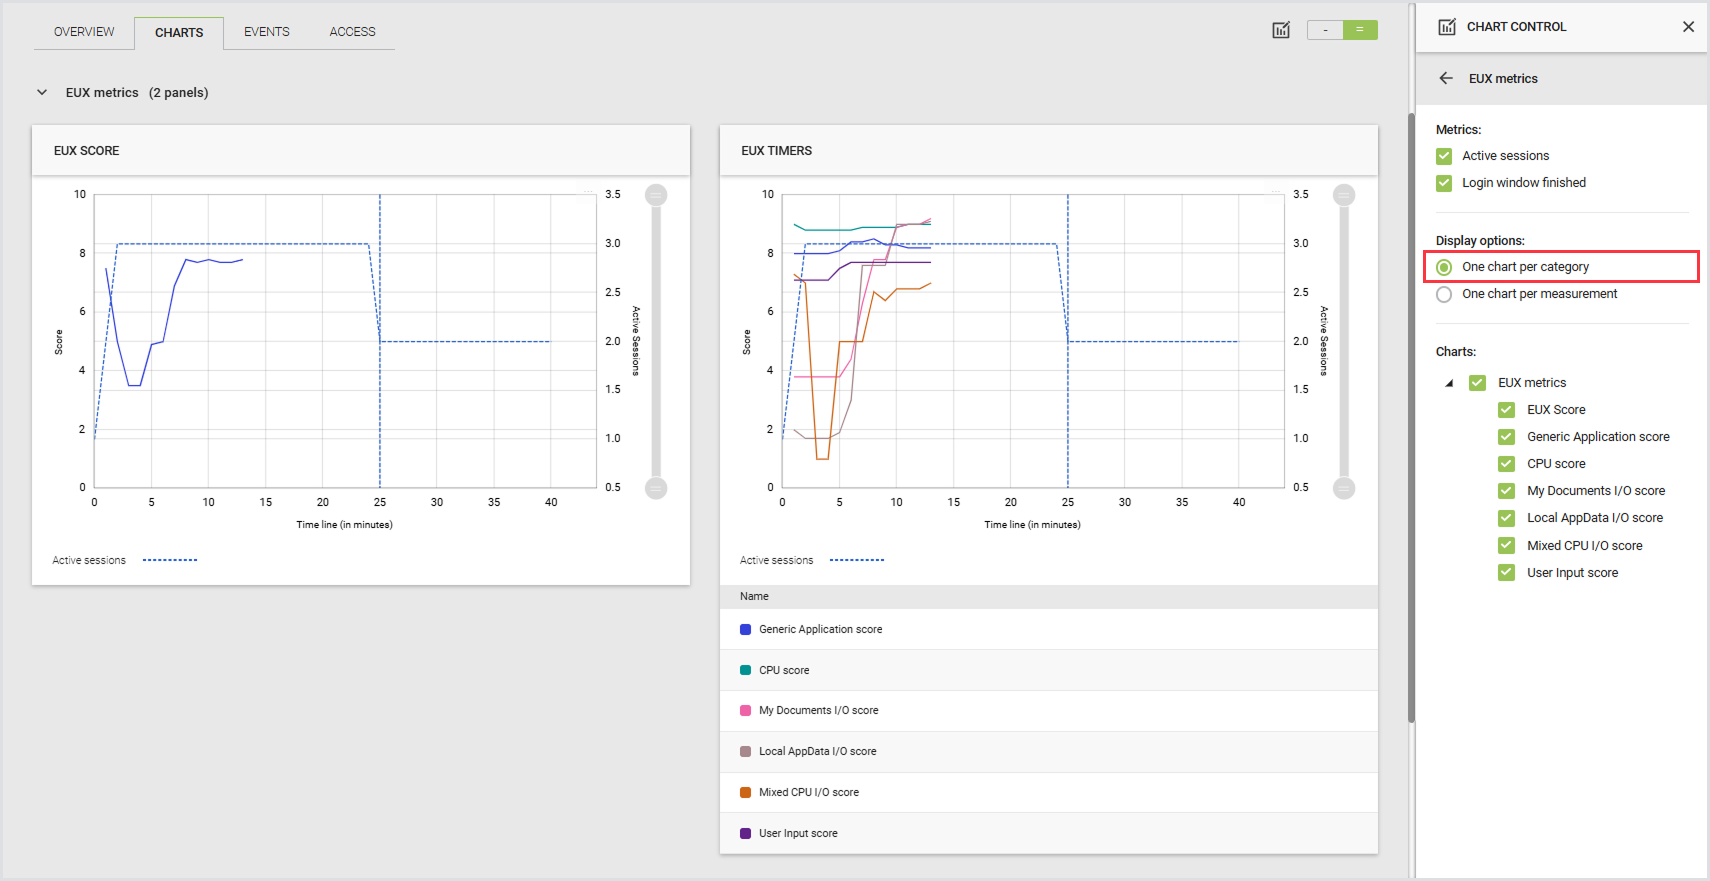
-
One chart per measurement: Combines multiple measurements into a single graph:

For Session Metrics, only one measurement per chart is shown:
You can choose to display charts either one per row or two side by side:
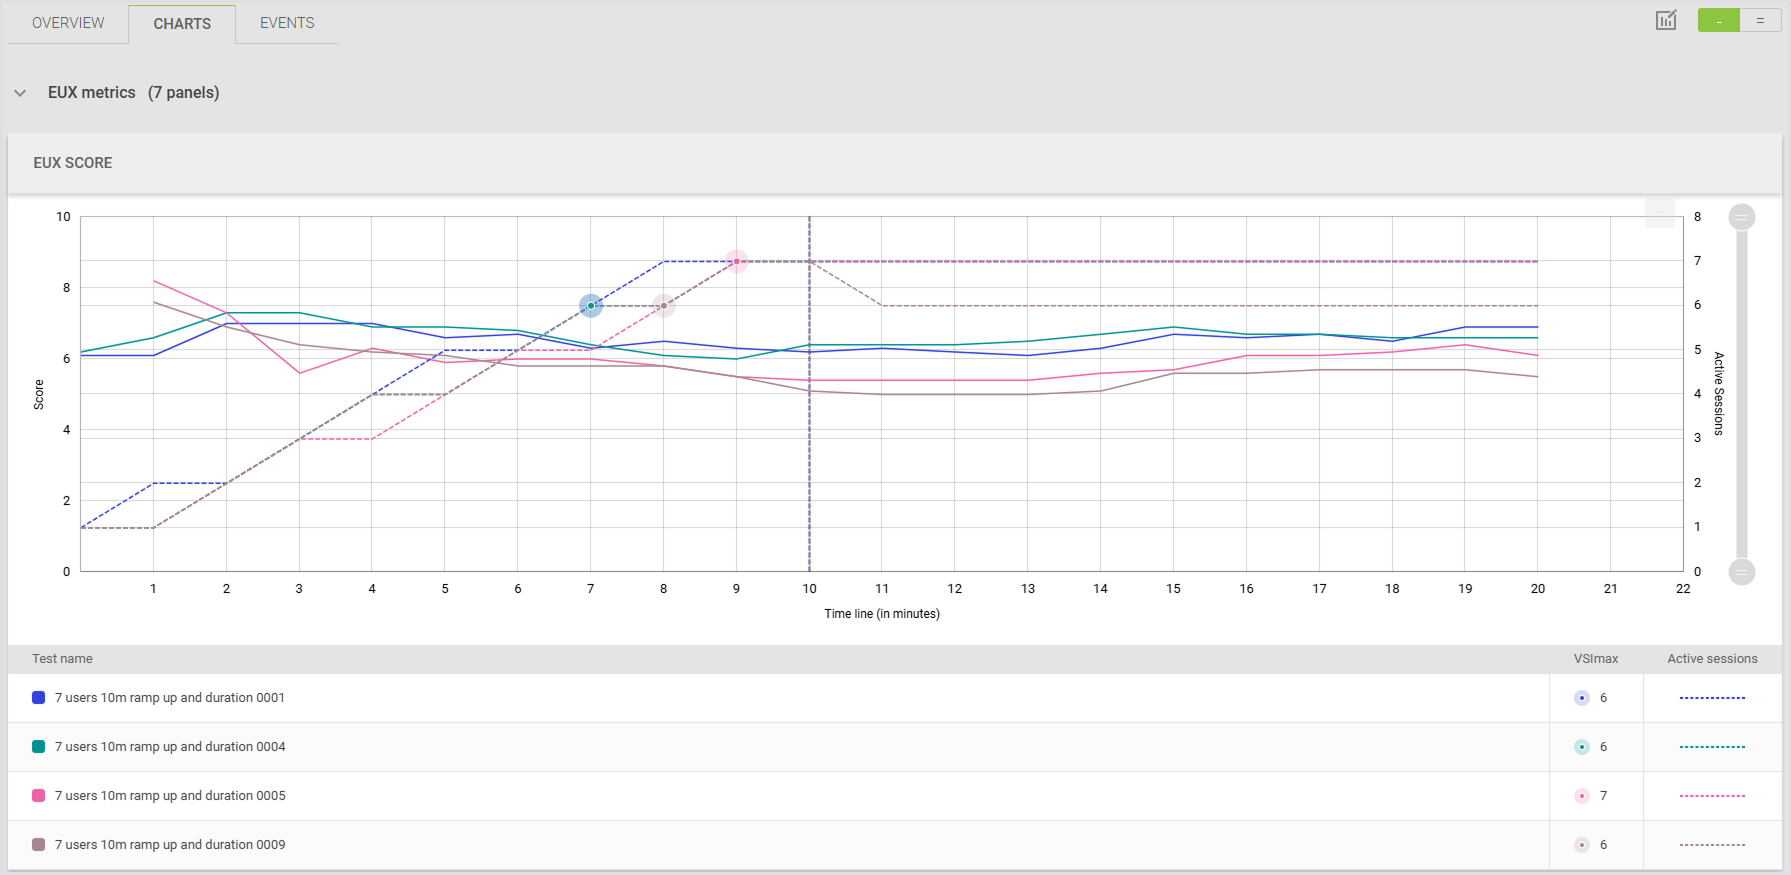
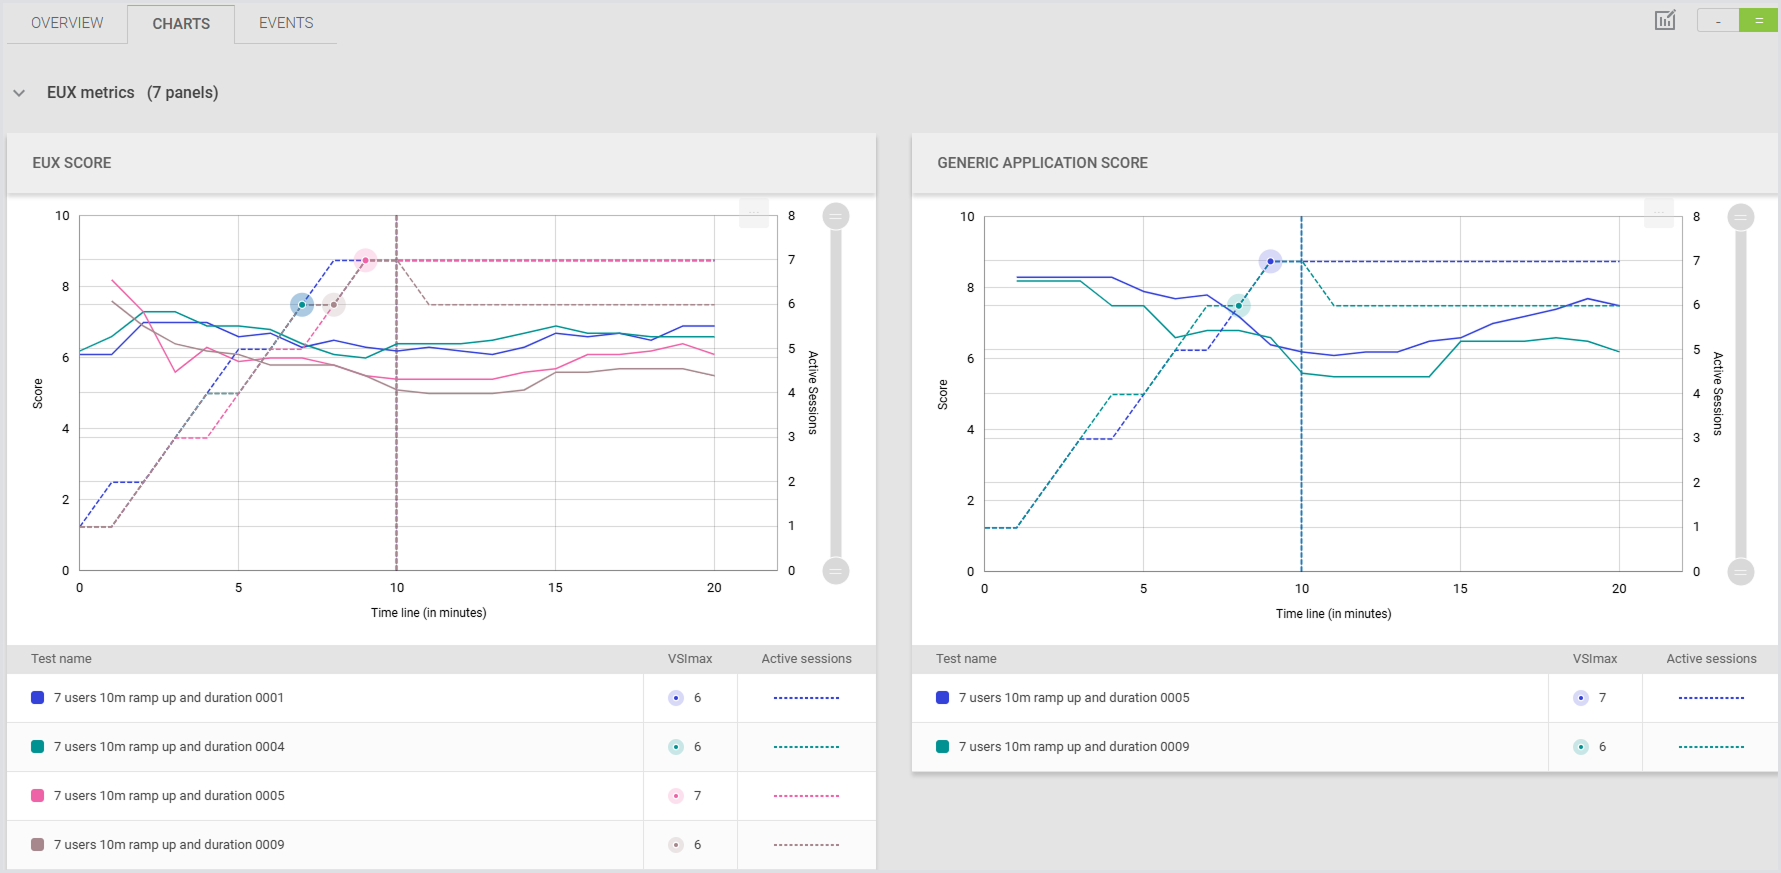
Chart Control lets you navigate and manage chart visibility and metrics. Categories can be expanded to show related charts, and specific metrics, such as active sessions or login duration, can be shown or hidden as needed. Categories without data are displayed but greyed out and cannot be selected.
-
Sticky Header: Ensures the chart control and display options are accessible regardless of your position on the page.
-
Interactive Legend: Click a legend item, and it will highlight that item in the chart, with other items being greyed out. Click the item again, and it will remove the highlight.
-
VSImax
-
Representation: In the charts, the VSImax is displayed as an orange dot.
-
Tooltip: When hovering over the chart, the orange VSImax dot will be displayed before the session count in the tooltip.
-
Legend: There is only one item for VSImax in the chart legend, and it applies to all Tests.
-
Condition: Be aware that not all Tests will have a VSImax. If the VSImax in the table is denoted as ">5" (greater than 5), it means that during the Test, the performance of the system was acceptable throughout. This indicates that the VSImax is greater than the number of users in the Test, and there will not be an orange icon in the charts for such cases.
-
-
EUX and Logons: Behave the same way in the charts as they do in the tables. The charts are always displayed regardless of whether the Baseline Test has data.
-
Applications and Session Metrics: Depend on the Baseline Test. Charts for these measurements are only shown if the Baseline Test includes the relevant data. For these categories, we will only display the applications and measurements that are present in the Baseline Test. If the other Tests have applications and/or measurements that are not in the Baseline Test, they will not be displayed.
-
Test Name Display: In the chart legend and tooltip, Test names are truncated in the middle if they are too long.
-
Information Messages: Displayed in the following scenarios:
-
When one or more Tests were run with different Login Enterprise versions.
-
When one or more Tests were run with different EUX versions.
-
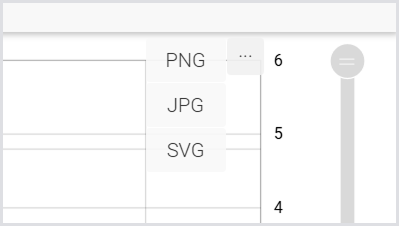
Downloading Charts as an Image
You can download charts as images for sharing or use in custom reports and presentations. Downloading a chart as an image applies to all charts: Load Test, Continuous Test, and Appliance Health. To download a chart:
-
Locate the Download icon in the top right corner of the chart.
-
Select image format: PNG, SVG, or JPG.
-
Download the image. It will be saved to your Downloads folder, or the directory you've configured as your default Downloads location.
Additional Resources
-
For general guidelines on analyzing Load Testing Session Metrics, consult Viewing Session Metrics.
-
For the accounts and account groups, see Managing Virtual User Accounts.
-
For the Launchers overview and best practices, see Launchers Overview and Best Practices.
-
To learn about the Login Enterprise Windows Launcher setup, configuration, maintenance, and more, see Configuring the Windows Launcher.