Overview
The Test Dashboard provides an overview of login failures and login performance metrics. This allows you to quickly identify issues and monitor the efficiency of the login process. The Dashboard only shows the status for currently enabled and running Tests. Once a Load Test or Application Test is completed, it will no longer show on the Dashboard.
Note: A Continuous Test is only visible when it’s enabled.
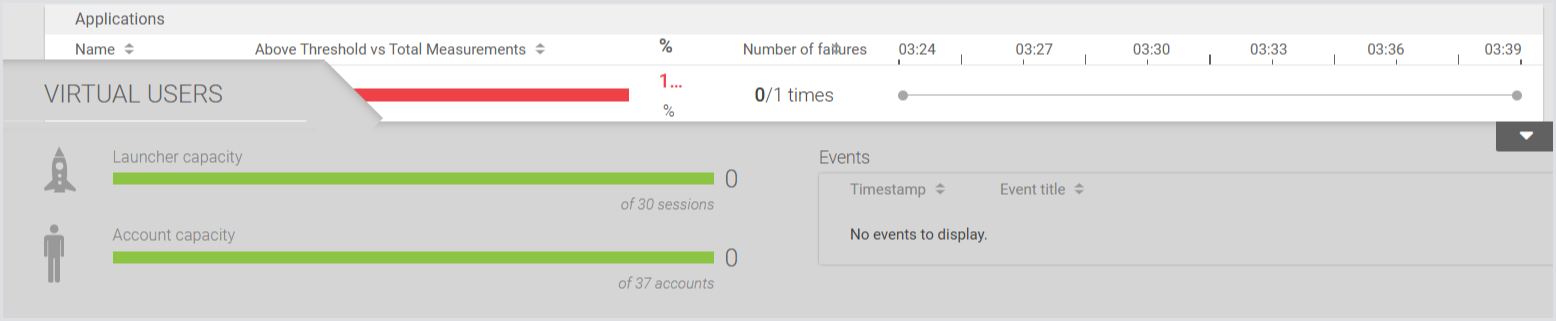
At the bottom of the page, you can also click to expand the Virtual Users section.
This displays information about Launcher capacity and Account capacity. Events are filtered, and only the following types are shown:
-
LauncherOffline
-
LauncherCapacityExceeded
-
AccountCapacityExceeded
-
AccountDisabled
For more information on Virtual Users, see Virtual Users.
Test Run View
Within the Test Run, you can further analyze login performance data and login failures separately. This breakdown allows for a more detailed investigation of each aspect, helping you pinpoint specific issues and optimize the login process.
To get more details on a particular Test Run, click on its tile in the Overview. You can limit your view to specific locations, if you have set locations for your Launchers, by selecting them from the pulldown at the top of the page.
Login Performance
This is where you can view a breakdown of various components in the logon process, along with our threshold marker measured in seconds. Additionally, you can refine your view by selecting different time spans, such as:
-
15m
-
30m
-
1h.
Note: The Logon failure data will only appear if the system has encountered any logon failures.
To learn more about the Login Performance, see Monitoring Login Performance.
Latency
Latency measurements are crucial for understanding the performance of your applications. By configuring and monitoring these measurements, you can identify performance issues and ensure your Test Run operates efficiently.
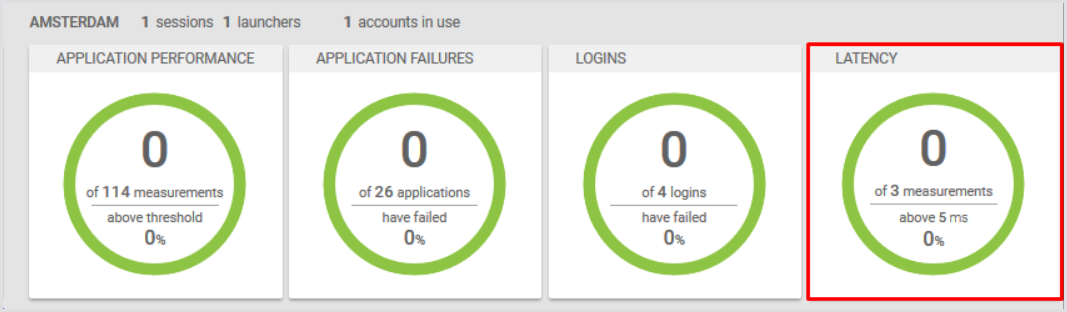
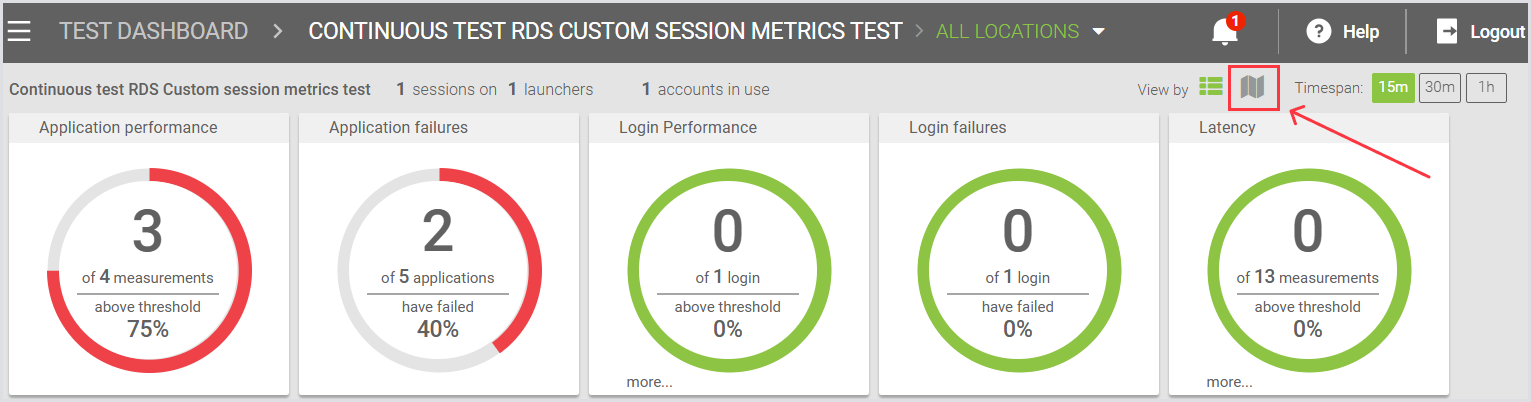
Once you have configured Latency measurements and set a threshold, you can view the data on the dashboard. The main dashboard will display Latency above threshold alongside other key metrics.
Tip: Click on the Latency tile to interact with the Latency data.
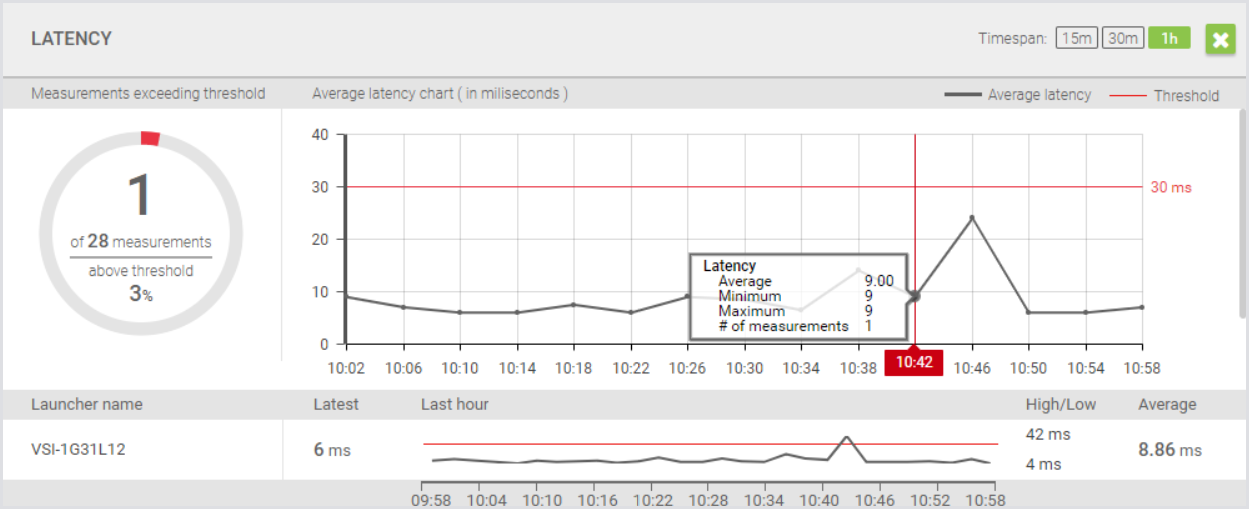
This is where you can view detailed activity and measurements over time. This includes:
-
Launcher name
-
Threshold
-
Number of measurements.
Tip: Hover over a Latency measurement in the Latency popup window to see a tooltip with precise measurement details.
Continuous Testing Results
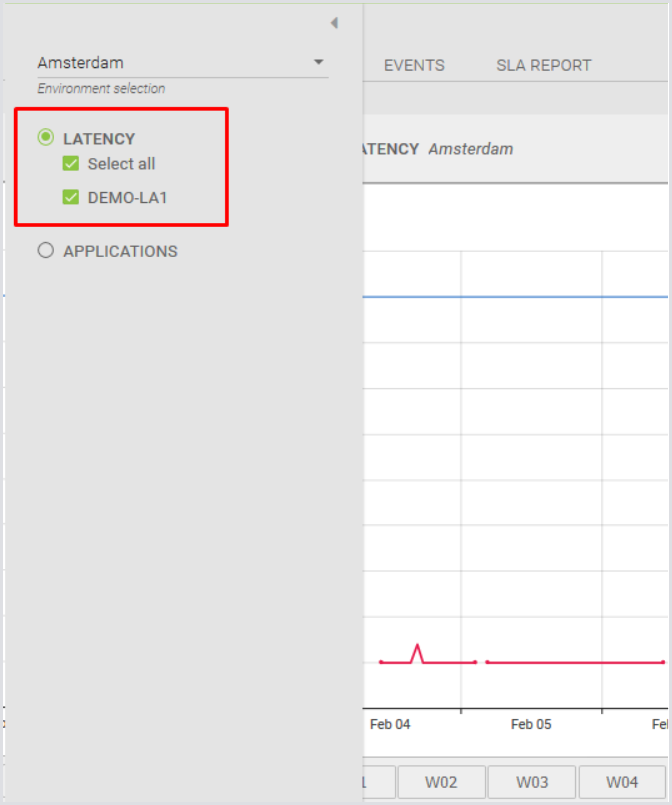
This is where you can view collected Latency measurements.
Tip: Select Latency measurements and Launchers set in the Test Run to see their specific Latency data.
The Latency chart operates similarly to other application charts. You can view Latency in milliseconds and adjust the time range to an Hour, Day, Week, or Month.
Tip: Use the Prediction to forecast future Latency trends.
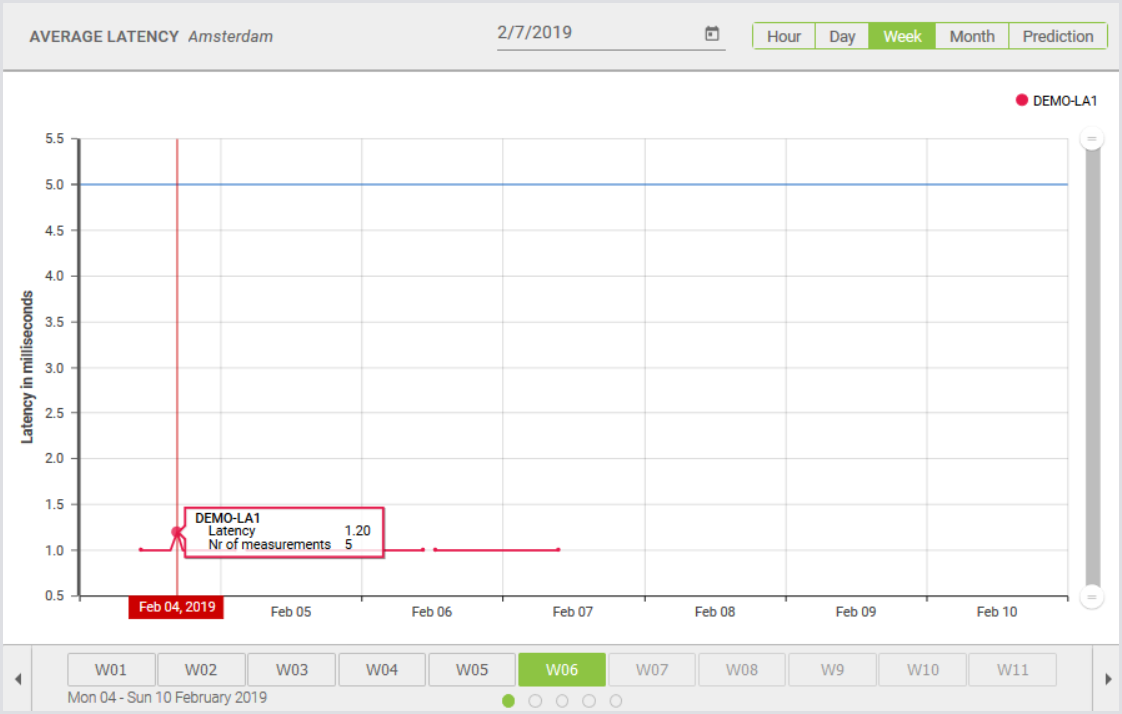
By following these steps, you can efficiently monitor Latency measurements through both the dashboard and reporting tools. Regular analysis of this data helps maintain optimal performance and address potential issues proactively. For more information on Latency, see Monitoring Latency.
Location View
If Launchers are attached to configured locations when a Continuous Test type is in progress, these Launchers will be visible in the map view. To access the map view, click the Map icon at the top of the Login performance page.
Then, the page will display a world map with Location(s) on it.
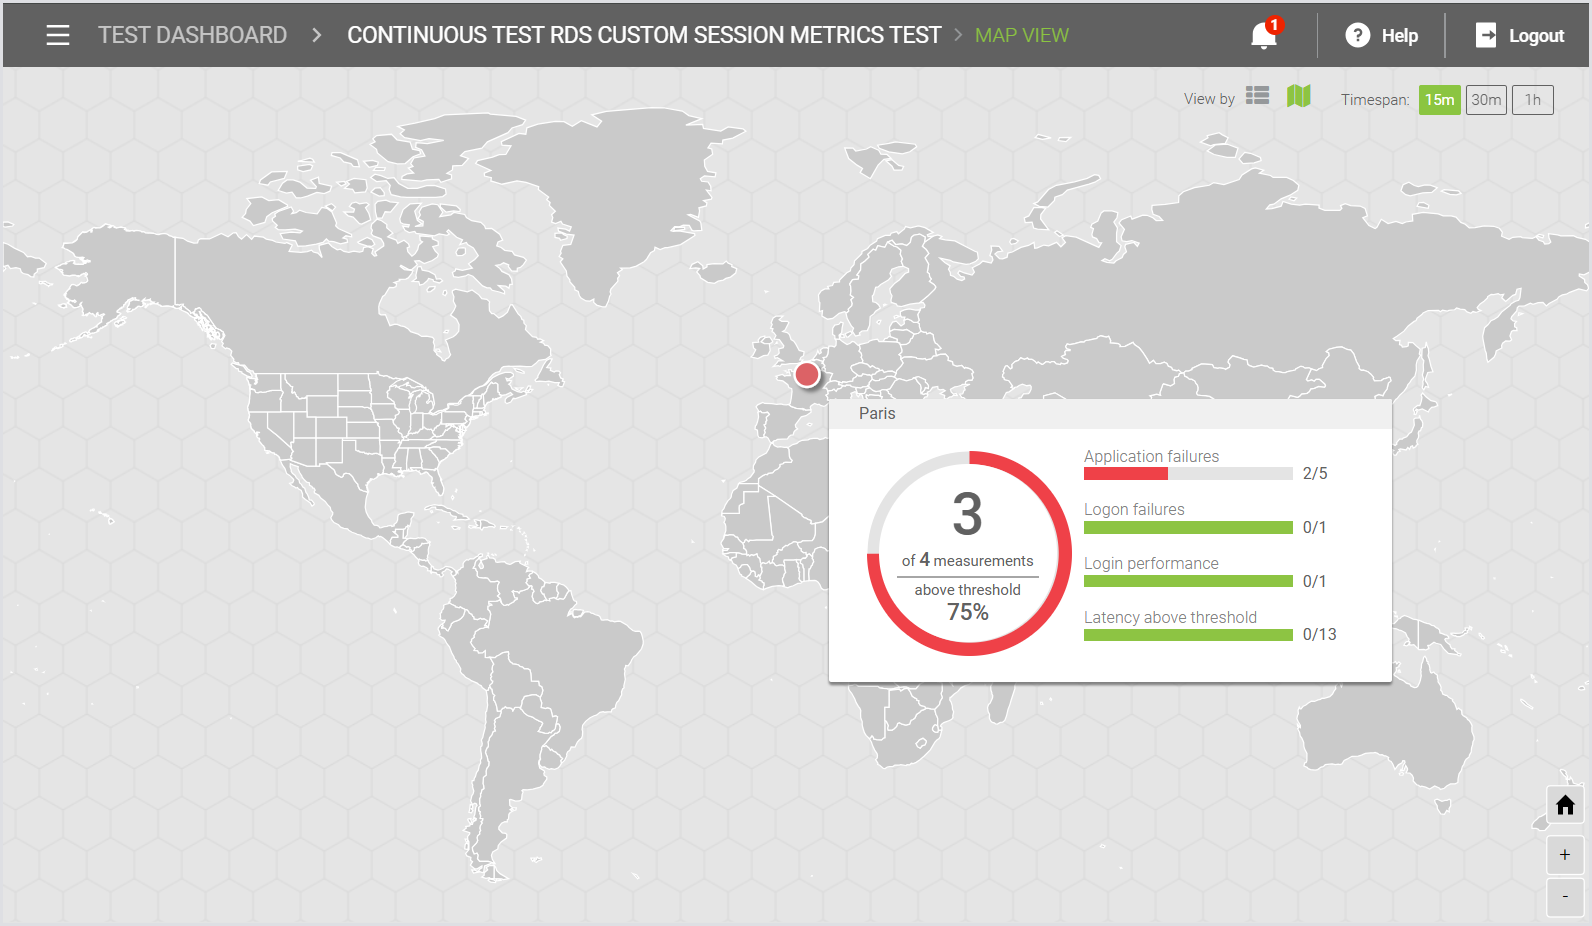
For more details on Locations, see Configuring Locations.