Overview
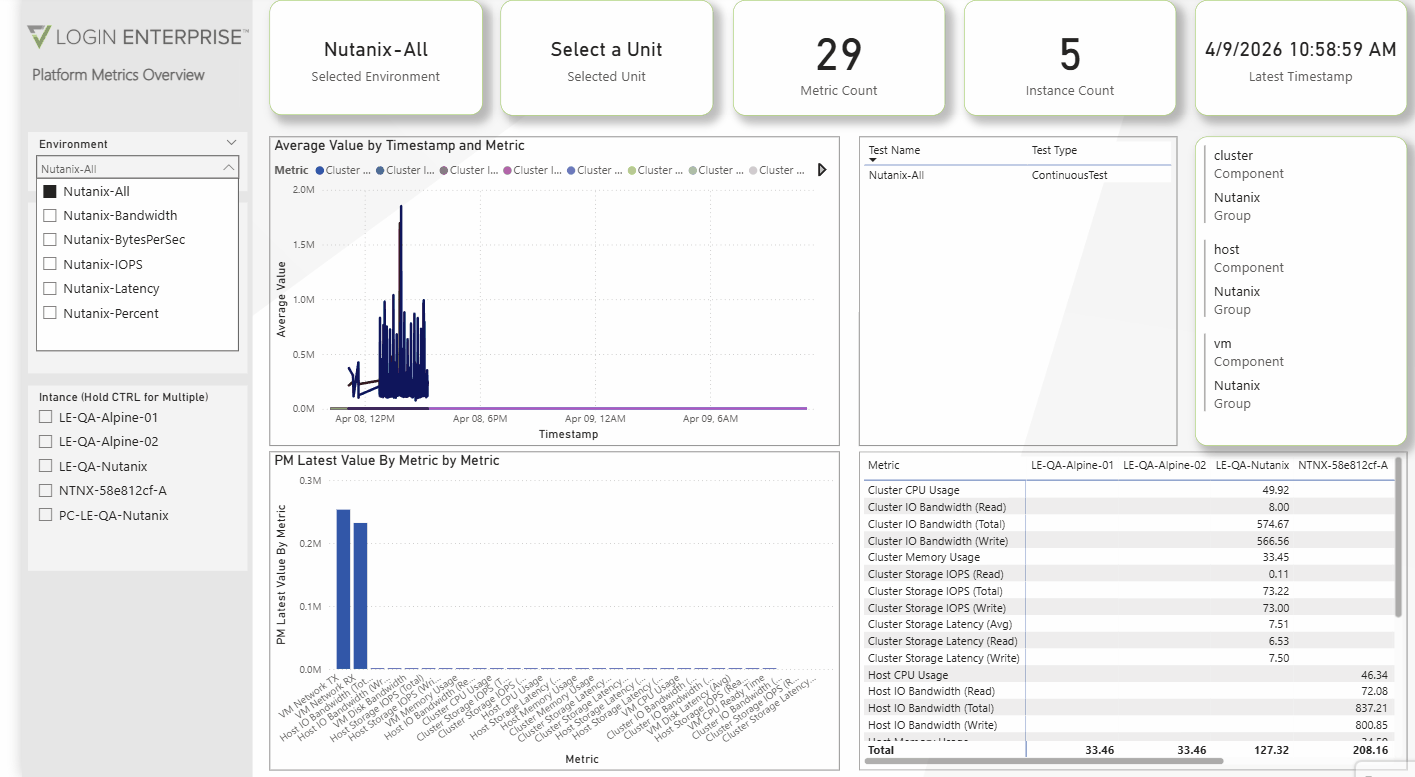
Login Enterprise can pull infrastructure metrics directly from Nutanix Prism and display them alongside your test results in Platform Metrics. During a Load Test or Continuous Test, you see EUX scores, session measurements, and Nutanix cluster, host, and VM metrics on the same timeline, without switching tools.
The solution is available in the Login VSI GitHub repo.
What You Can Do With It
Three use cases drive most of the value here:
-
Continuous Testing keeps Nutanix infrastructure metrics flowing 24/7 alongside user experience scores. If something changes overnight, you see it in Platform Metrics the next morning, next to the EUX data, not in a separate tool.
-
Load Testing lets you correlate infrastructure saturation with EUC performance degradation as user count climbs. When EUX scores drop, you can check immediately whether the host CPU was already at 90%, whether storage latency climbed during the ramp, or whether a specific VM's disk bandwidth maxed out.
-
Migration and bake-off scenarios let you run the same workload across two configurations, or two EUC stacks on the same Nutanix infrastructure, and compare Platform Metrics side by side. CPU behavior, IOPS, and VM-level latency across identical workloads. The data makes platform decisions easier to justify.
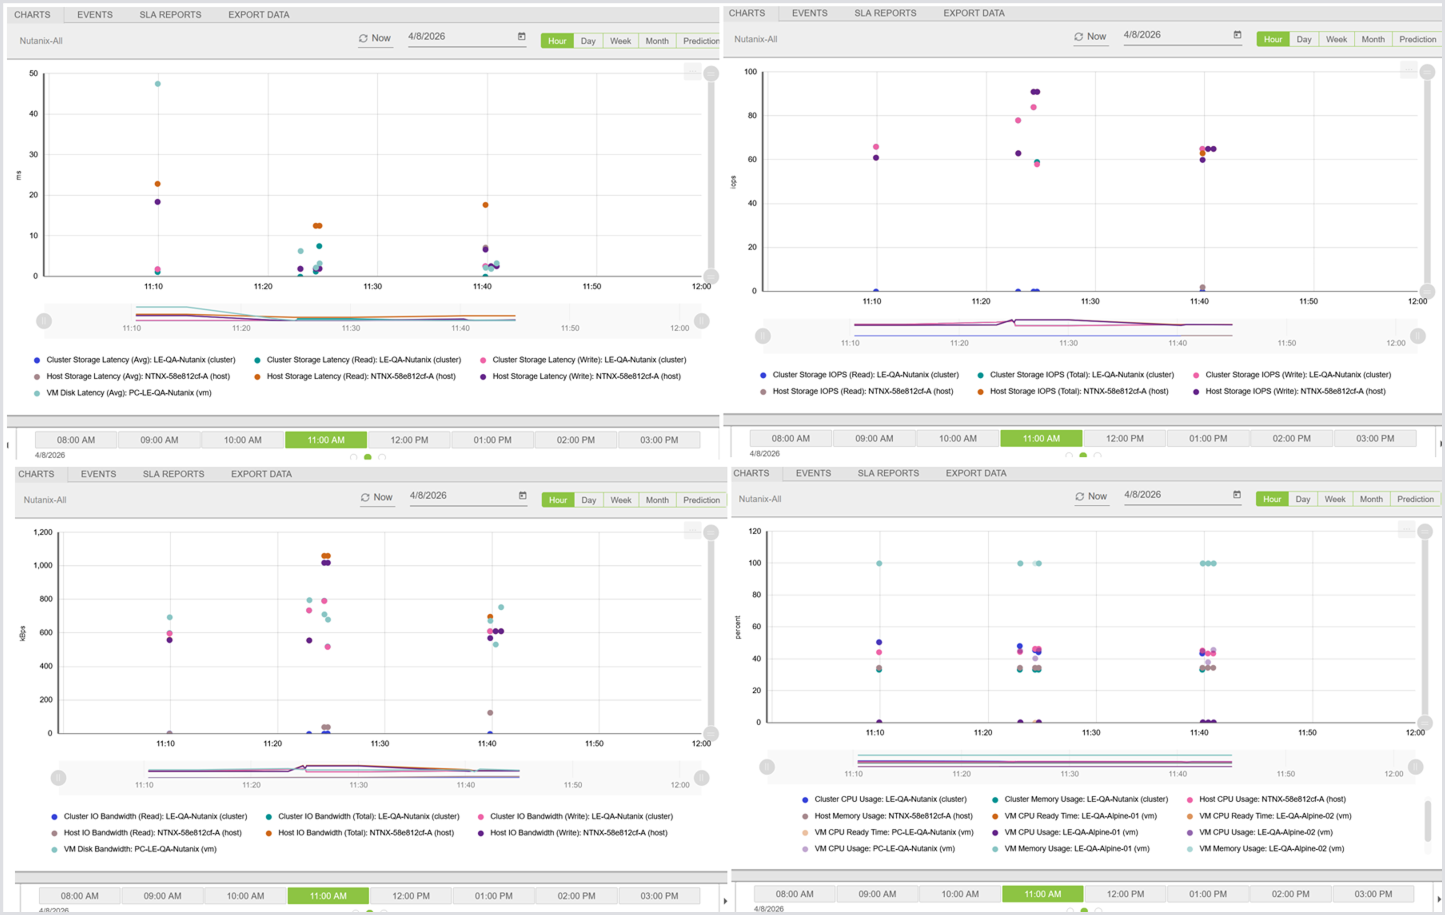
Metrics Collected
Cluster-Level (via Prism Central v4 API, Prism Element v2 fallback)
|
Metric |
Unit |
|---|---|
|
Cluster CPU Usage |
percent |
|
Cluster Memory Usage |
percent |
|
Cluster Storage IOPS (Total, Read, Write) |
iops |
|
Cluster Storage Latency (Avg, Read, Write) |
ms |
|
Cluster IO Bandwidth (Total, Read, Write) |
kBps |
Host-Level (via Prism Central v4 API)
|
Metric |
Unit |
|---|---|
|
Host CPU Usage |
percent |
|
Host Memory Usage |
percent |
|
Host Storage IOPS (Total, Read, Write) |
iops |
|
Host Storage Latency (Avg, Read, Write) |
ms |
|
Host IO Bandwidth (Total, Read, Write) |
kBps |
VM-Level (via Prism Central v4 API)
|
Metric |
Unit |
|---|---|
|
VM CPU Usage |
percent |
|
VM CPU Ready Time |
percent |
|
VM Memory Usage |
percent |
|
VM Disk Latency (Avg) |
ms |
|
VM Disk Bandwidth |
kBps |
|
VM Network RX |
bytesPerSec |
|
VM Network TX |
bytesPerSec |
Note: Cluster-level metrics work without Prism Central. Host and VM metrics require it.
Requirements
Nutanix
|
Component |
Minimum Version |
Notes |
|---|---|---|
|
AOS (Prism Element) |
6.7 |
Cluster-level stats via PE v2 API |
|
Prism Central |
2024.3 |
Required for host and VM stats |
|
AHV |
10.x |
VM stats tested on AHV only |
The integration has been tested against AOS 6.8.1, AOS 6.10.1, Prism Central 2024.3, and Prism Central 2024.3.1.4.
On Prism Central 7.5 and newer, the script negotiates the API version automatically. On older PC versions (any pc.YYYY.x format), it defaults to v4.0.
Login Enterprise
-
Login Enterprise appliance with Platform Metrics enabled
-
API token with Configuration access level
-
Network access from the machine running the script to the Nutanix port 9440 and the Login Enterprise port 443
PowerShell
-
Windows PowerShell 5.1 (tested and validated)
-
PowerShell 7.x (compatible)
-
No admin privileges required
Login Enterprise Setup
-
Enable Platform Metrics
-
Platform Metrics is currently a preview feature. Enable it in your browser's DevTools console (F12 in most browsers):
leSetFeatureFlag('platformMetrics', 1) -
Refresh the page after running.
-
-
Create an Environment
-
In Configuration > Environments, create a single environment named, for example, Nutanix Platform Metrics. This environment receives all metric types from the collector.
-
Copy the UUID of the environment from the browser URL bar when viewing it. You will use this as the -LEEnvironmentId parameter when running the script.
-
-
Create a Test: Link the environment to a continuous test or a load test. The Platform Metrics tab appears on test result pages once an environment is linked. For more on creating tests, see Configuring Continuous Testing and Configuring Load Testing.
-
Create an API Token: Configuration > System Access Tokens > create a token with Configuration access level.
Quick Start
If you omit -NutanixPassword or -LEApiToken, the script prompts for them securely at runtime. You can also pass them on the command line if running unattended.
Cluster stats only (no Prism Central required)
.\Nutanix-LE-PlatformMetrics.ps1 `
-NutanixHost "your-nutanix-prism.example.com" `
-LEApplianceUrl "https://your-le-appliance.example.com" `
-LEEnvironmentId "uuid-nutanix-all" `
-RunOnce
Cluster + host + VM stats (requires Prism Central)
.\Nutanix-LE-PlatformMetrics.ps1 `
-NutanixHost "your-nutanix-prism.example.com" `
-PrismCentralHost "your-prism-central.example.com" `
-ClusterExtId "your-cluster-ext-id" `
-LEApplianceUrl "https://your-le-appliance.example.com" `
-LEEnvironmentId "uuid-nutanix-all" `
-CollectHostStats `
-CollectVmStats `
-RunOnce
Continuous polling (run until Ctrl+C)
.\Nutanix-LE-PlatformMetrics.ps1 `
-NutanixHost "your-nutanix-prism.example.com" `
-PrismCentralHost "your-prism-central.example.com" `
-ClusterExtId "your-cluster-ext-id" `
-LEApplianceUrl "https://your-le-appliance.example.com" `
-LEEnvironmentId "uuid-nutanix-all" `
-CollectHostStats `
-CollectVmStats
Filter to specific VMs
.\Nutanix-LE-PlatformMetrics.ps1 `
-NutanixHost "your-nutanix-prism.example.com" `
-PrismCentralHost "your-prism-central.example.com" `
-ClusterExtId "your-cluster-ext-id" `
-LEApplianceUrl "https://your-le-appliance.example.com" `
-LEEnvironmentId "uuid-nutanix-all" `
-CollectVmStats `
-VmFilter "MyLauncher-01,MyLauncher-02,MyTarget-01" `
-RunOnce
Dry run (verify connectivity without uploading)
.\Nutanix-LE-PlatformMetrics.ps1 `
-NutanixHost "your-nutanix-prism.example.com" `
-LEApplianceUrl "https://your-le-appliance.example.com" `
-LEEnvironmentId "uuid-nutanix-all" `
-CollectHostStats `
-CollectVmStats `
-DryRun -RunOnce
How Long to Run the Collector
You have flexibility here. Two common approaches:
-
Run it continuously alongside a continuous test or ongoing monitoring window. The script loops on its own polling interval until you stop it with Ctrl+C, or you can set it up as a scheduled task or startup item on the data collector machine (see Running as a Windows Scheduled Task). This is the right approach for continuous testing or overnight validation runs.
-
Start and stop it around specific tests. If you only care about infrastructure data during a particular load test, just launch the script before the test starts and stop it when the test ends. Use -RunOnce for a single collection iteration, which is handy for quick spot-checks or verifying connectivity before committing to a longer run.
Collector Script Parameters
Nutanix Connection
Both -NutanixPassword and -LEApiToken are optional on the command line. If either is omitted, the script prompts for it securely at runtime; the input is masked and never echoed. Neither is ever written to the script's log files or stored anywhere by the script. If your environment uses a secrets vault or credential manager, you can modify the script to retrieve credentials from that source.
|
Parameter |
Required |
Description |
|
-NutanixPassword |
No |
Prism Element admin password |
|
-NutanixHost |
Yes |
Prism Element IP or hostname (port 9440) |
|
-NutanixUser |
No |
Prism Element username (default: admin) |
|
-PrismCentralHost |
Conditional |
Required for -CollectHostStats or -CollectVmStats |
|
-ClusterExtId |
Conditional |
Required for host and VM stats. See Finding Your Cluster ExtId. |
Login Enterprise Connection
|
Parameter |
Required |
Description |
|
-LEApiToken |
No |
LE API token (Configuration access level) |
|
-LEApplianceUrl |
Yes |
Full URL of LE appliance |
|
-LEApiVersion |
No |
API version segment (default: v8-preview) |
Environment ID
|
Parameter |
Description |
|
-LEEnvironmentId |
UUID of the Nutanix-All environment you created during setup |
Collection Scope
|
Parameter |
Default |
Description |
|
-CollectHostStats |
off |
Enable host-level metrics (requires PC) |
|
-CollectVmStats |
off |
Enable VM-level metrics (requires PC) |
|
-VmFilter |
(all) |
Comma-separated VM names to collect. If omitted, it collects all powered-on VMs. Names are case-sensitive and must match exactly as they appear in Prism Element. |
Run Control
|
Parameter |
Default |
Description |
|
-RunOnce |
off |
Run one iteration and exit |
|
-Iterations |
0 (unlimited) |
Run N iterations and exit |
|
-PollingIntervalSec |
30 |
Seconds between polls |
|
-DryRun |
off |
Collect metrics but do not upload to LE |
|
-SkipTimeSync |
off |
Skip LE time sync |
Output and Diagnostics
|
Parameter |
Description |
|
-LogDir |
Directory for log files (default: script directory) |
|
-Verbose |
Enable detailed per-metric logging |
Certificate Handling Parameters
|
Parameter |
Description |
|
-IgnoreCertificateErrors |
Bypass TLS certificate validation for the Login Enterprise appliance connection. See Certificate Handling. |
Retrieval Script
Get-LEPlatformMetrics.ps1 queries the Login Enterprise API and exports metrics to CSV and JSON. Use it to verify data after a run, pull results for analysis, or feed Power BI.
Examples
# Last 1 hour
.\Get-LEPlatformMetrics.ps1 `
-LEApiToken "YourToken" `
-BaseUrl "https://your-le-appliance.example.com" `
-EnvironmentId "uuid-nutanix-all" `
-LastHours 1
# Specific time range
.\Get-LEPlatformMetrics.ps1 `
-LEApiToken "YourToken" `
-BaseUrl "https://your-le-appliance.example.com" `
-EnvironmentId "uuid-nutanix-all" `
-StartTime "2026-04-08T10:00:00.000Z" `
-EndTime "2026-04-08T11:00:00.000Z"
Output Files
|
File |
Description |
|
Get-LEPlatformMetrics_YYYYMMDD_HHMMSS.csv |
Flat data, one row per data point |
|
Get-LEPlatformMetrics_YYYYMMDD_HHMMSS.json |
Raw API response |
|
Get-LEPlatformMetrics_Log_YYYYMMDD_HHMMSS.txt |
Run log |
CSV columns: timestamp, value, metricId, environmentKey, displayName, unit, instance, componentType, group, customTags
Parameters
|
Parameter |
Required |
Description |
|
-LEApiToken |
Yes |
LE API token |
|
-BaseUrl |
Yes |
LE appliance URL |
|
-EnvironmentId |
Yes |
Environment UUID |
|
-LastHours |
No |
Hours of data to retrieve (default: 1) |
|
-StartTime |
No |
ISO 8601 start time (overrides -LastHours) |
|
-EndTime |
No |
ISO 8601 end time |
|
-ApiVersion |
No |
LE API version (default: v8-preview) |
|
-OutputDir |
No |
Output directory (default: script directory) |
|
-MetricGroups |
No |
Filter by metric group name |
|
-IgnoreCertificateErrors |
No |
Bypass TLS certificate validation for the Login Enterprise appliance connection. See Certificate Handling. |
Where to Run the Scripts
The scripts run from any Windows machine with network access to Nutanix (port 9440) and the Login Enterprise appliance (port 443). Common setups include a dedicated management or jump box, a Login Enterprise Launcher VM on the same network as the Nutanix cluster, or a workstation with VPN access to both environments. There is no agent, no service installation, and no requirement to run on the Nutanix host itself.
Running as a Windows Scheduled Task
One way to keep the collector running continuously is to set it up as a Windows Scheduled Task. This is just one example. How you manage startup and persistence on your data collector host is entirely up to you. A login startup script, a service wrapper, or just launching it manually before a test window all work fine.
For a scheduled task setup:
-
Open Task Scheduler and select Create Task.
-
On the General tab, give the task a name (e.g., "Nutanix LE Metrics"), select Run whether user is logged on or not, and check Run with highest privileges.
-
On the Triggers tab, create a new trigger on a schedule. Daily with a repeat interval works well if you want the OS to restart the script on failure. The script handles its own polling loop internally.
-
On the Actions tab, create a new action: Start a program. Set the program to powershell.exe and the arguments to:
-NonInteractive -ExecutionPolicy Bypass -File "C:\Scripts\Nutanix-LE-PlatformMetrics.ps1" -NutanixPassword "YourPassword" -LEApiToken "YourToken" -NutanixHost "your-nutanix.example.com" -LEApplianceUrl "https://your-le-appliance.example.com" -LEEnvironmentId "your-env-uuid" -CollectHostStats -CollectVmStats
Note: Because scheduled tasks run unattended, -NutanixPassword and -LEApiToken must be passed explicitly. The secure prompt only works when running the script manually.
-
On the Settings tab, check If the task is already running, do not start a new instance.
Tip: Avoid hardcoding passwords in task arguments visible to other users on shared machines. Use a dedicated service account with read-only Nutanix access where possible.
Finding Your Cluster ExtId
The Cluster ExtId is required for host and VM stats. Retrieve it from Prism Central using your browser or a REST client:
https://your-prism-central.example.com:9440/api/clustermgmt/v4.0/config/clusters
Authenticate with your Prism Central credentials and look for the extId field in the response for your cluster.
Certificate Handling
Most environments won't need this. If the script connects to your Login Enterprise appliance without any SSL errors, skip this section.
If you receive an SSL/TLS error such as "The underlying connection was closed: Could not establish trust relationship for the SSL/TLS secure channel," the machine running the scripts does not trust the certificate presented by the LE appliance.
Nutanix (Prism Element and Prism Central)
Prism uses self-signed certificates by default. The scripts handle this automatically: no configuration needed on the Nutanix side. If your organization has replaced the default Prism certificate with a CA-issued cert, ensure that CA's root certificate is trusted on the machine running the scripts. The scripts do not manage Nutanix certificates.
Login Enterprise appliance: if using a certificate from your organization's CA
Export the root CA certificate (and any intermediate CA certificates) and install them into Trusted Root Certification Authorities on the machine running the scripts. For guidance on managing certificates in the Windows certificate store, see the Microsoft documentation on Trusted Root Certification Authorities. For Login Enterprise appliance certificate management, see Managing Certificates on the Appliance.
Once the certificate is trusted on the machine, run the scripts normally without any additional flags.
Login Enterprise appliance: if using the default LE self-signed certificate
Use -IgnoreCertificateErrors to bypass certificate validation for the Login Enterprise appliance connection:
.\Nutanix-LE-PlatformMetrics.ps1 `
    -NutanixHost "your-nutanix-prism.example.com" `
    -LEApplianceUrl "https://your-le-appliance.example.com" `
    -LEEnvironmentId "uuid-nutanix-all" `
    -IgnoreCertificateErrors `
    -RunOnce
-IgnoreCertificateErrors bypasses TLS certificate validation for the Login Enterprise appliance connection, which means the connection does not verify the identity of the appliance. Review your organization's security policies before using this flag in your environment. Some endpoint security solutions may also generate alerts when certificate validation is bypassed at the application level.
Power BI
A Power BI connector and report template for Login Enterprise (which includes Platform Metrics) is available in the Login VSI GitHub repo. The Login Enterprise Environment setup described in this doc works directly with the connector; all metrics land in one environment, keeping the connector configuration straightforward.
Caveats and Known Behaviors
-
VM stats require a warm-up period: After a VM is created or powered on, Prism Central needs 5-10 minutes before the stats endpoint returns data. The script handles this gracefully.
-
VM Memory Usage at 100% for the Prism Central VM is expected: PC pre-allocates its full memory allocation at startup.
-
Host metric count varies by run (typically 8-11 metrics): Some host metrics return null when there is no activity for that stat in the sampling window, e.g., no read IOPS means no read latency value. The script skips nulls and uploads only what it receives. This is correct behavior.
-
Cluster stats occasionally return 0 metrics on older CE hardware: The Prism Element v2 API can intermittently return empty stats on Nutanix Community Edition. This does not affect production clusters.
-
Prism Central v4 API rate limits VM stats calls: The script adds a 500ms delay between VM calls to reduce this. On very large clusters (50+ VMs), the collection loop may exceed the 30-second polling interval. The script detects this and starts the next iteration immediately rather than compounding the delay.
-
Prism Central connectivity: If PC is unreachable, the script detects this at startup and skips all PC-dependent work. Cluster stats continue normally.
-
Prism Element v2 API deprecation: Nutanix has announced that the PE v2 API is planned for deprecation. The script uses Prism Central v4 for cluster stats by default and only falls back to PE v2 when Prism Central is unavailable. Configuring Prism Central is recommended to avoid disruption when v2 is retired.
Troubleshooting
-
Host stats return 400 "startTime or endTime refer to time in future": Minor clock skew between the machine running the script and the Nutanix cluster. The script automatically offsets the endTime by 30 seconds to compensate. If you see this occasionally, it is harmless.
-
Pre-flight fails with "Nutanix PE: connection failed": Verify the host is reachable on port 9440, check the username and password, and confirm VPN access if required.
-
Pre-flight warns "Prism Central: connection failed": Host and VM stats will be skipped for this run. Cluster stats still collect and upload. Check the PC IP or hostname and verify port 9440 access.
-
Upload timeout errors: Usually transient. The retry logic (3 attempts, exponential backoff) handles these. If persistent, check LE appliance connectivity and API token validity. Uploading to a non-existent environment ID will cause the server to close the connection.
-
VM stats show 404 errors: PC may not have collected a stats window yet for newly created VMs. Wait 5-10 minutes and try again. You can also verify the VM ExtId is valid in PC at /api/vmm/v4.0/ahv/config/vms/{extId}.
-
429 Too Many Requests on VM stats: PC is rate-limiting consecutive VM stats calls. The script logs a warning and skips that VM for that iteration. Use -VmFilter to reduce the number of VMs being monitored.
-
VmFilter returns 0 matches: VM names are case-sensitive and must match exactly as they appear in Prism Element. Verify the VM name in the Prism Element UI.
-
SSL/TLS or certificate errors: The Login Enterprise appliance certificate is not trusted on the machine running the script. If the appliance uses a certificate from your organization's CA, install the root CA certificate on this machine. If the appliance uses its default self-signed certificate, re-run with
-IgnoreCertificateErrors. See Certificate Handling. -
Enable verbose logging for more detail: .\Nutanix-LE-PlatformMetrics.ps1 -NutanixPassword "pass" -LEApiToken "token" ... -Verbose -RunOnce
Security
Passwords and API tokens are passed as command-line parameters at runtime and are never written to the script's log files or stored anywhere by the script. If your organization uses a secrets vault or credential manager, you can modify the script to pull credentials from that source rather than accepting them directly on the command line.
Files
|
File |
Description |
|
Nutanix-LE-PlatformMetrics.ps1 |
Collector script |
|
Get-LEPlatformMetrics.ps1 |
Retrieval and export script |
What's Coming
This integration today runs as a standalone PowerShell script outside of Login Enterprise. The plan is to bring it natively into the product as a supported, built-in integration, no external scripts required. When that happens, the setup experience will change, and this documentation will be updated accordingly. Keep an eye on the Login Enterprise release notes for updates.
Additional Resources
-
For the Nutanix v4 API reference, see the Nutanix v4 API reference.
-
For details on Nutanix PC v4 API version negotiation, refer to Nutanix v4 SDK: API Version Negotiation in Prism Central 7.5.