Hydra DVC Plugin Installation and Endpoint Diagnostics
Use the optional Hydra DVC plugin on the client to see diagnostics from the device running Windows App. The plugin connects to the Hydra Agent in the remote session over a dynamic virtual channel (DVC), so network connectivity is not required between the client endpoint and Hydra.
Download the plugin
In Hydra, open Tenants and select Hydra DVC Plugin for the tenant. In the dialog, select Download the Hydra DVC Plugin (MSI).

Install the plugin on the endpoint
Deploy the MSI to the Windows client devices that run Windows App. Use a software deployment tool such as Intune and pass the tenant channel secret in the CHANNELSECRET MSI property. The secret must match the one used by the Hydra Agent on the session host. Keep the secret secure.
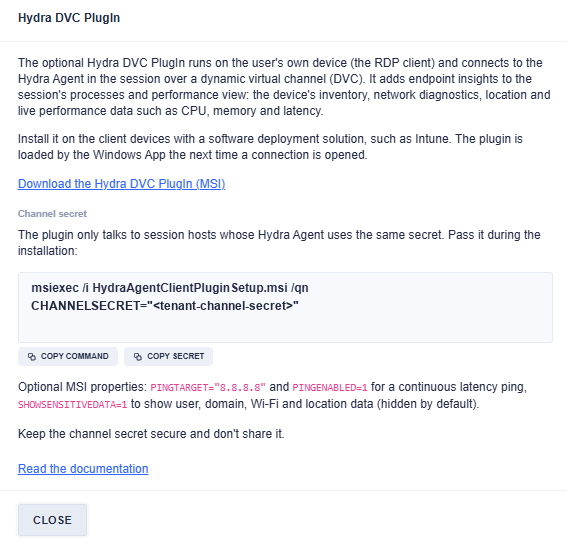
After installation, open a new connection in Windows App to load the plugin.
Open endpoint details for a user session
In User Sessions, select the pulse icon for the session you want to inspect. In Processes and Performance, scroll the tab row horizontally if needed to see Endpoint Inventory, Endpoint Network Data, Endpoint Location, and Endpoint Performance.
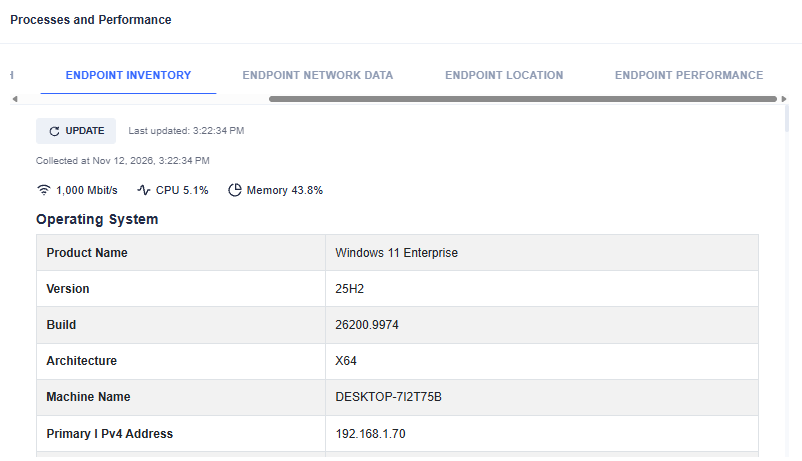
Start with Endpoint Inventory to identify the client device. Check the OS version and build, architecture, machine name, primary IPv4 address, and much more. The summary at the top shows link speed, ping statistics (once generated), CPU usage, and memory usage. Select Update to refresh the snapshot.
Inspect the endpoint network path
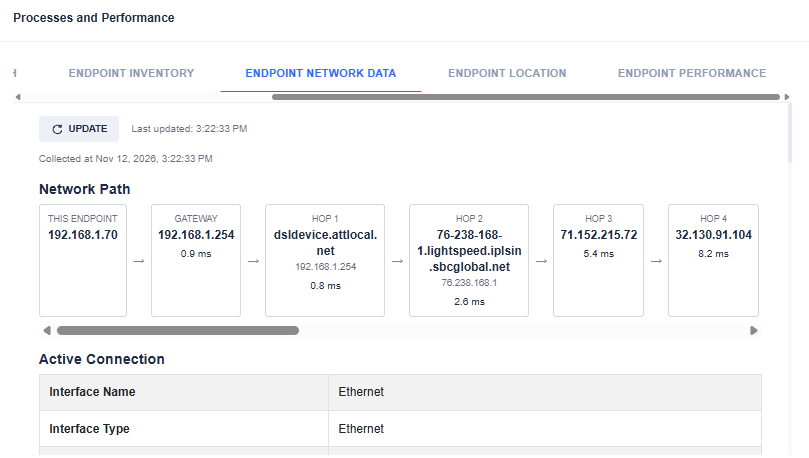
Open Endpoint Network Data. Network Path shows the endpoint, gateway, and successive hops with their measured latency in milliseconds where available. Scroll across the path for additional hops. Active Connection shows the client network interface and its type, such as Ethernet. Scroll down to see even more network-related information on the endpoint.
View the endpoint location
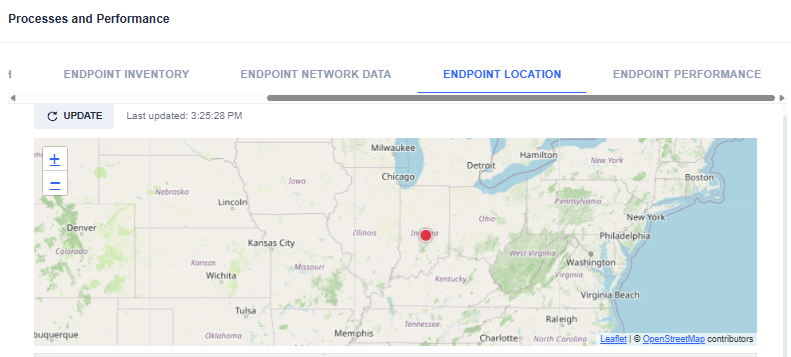
Open Endpoint Location to see the reported location on the map. Use the plus and minus controls or mouse wheel to zoom and Update to refresh the view.
Review endpoint performance over time
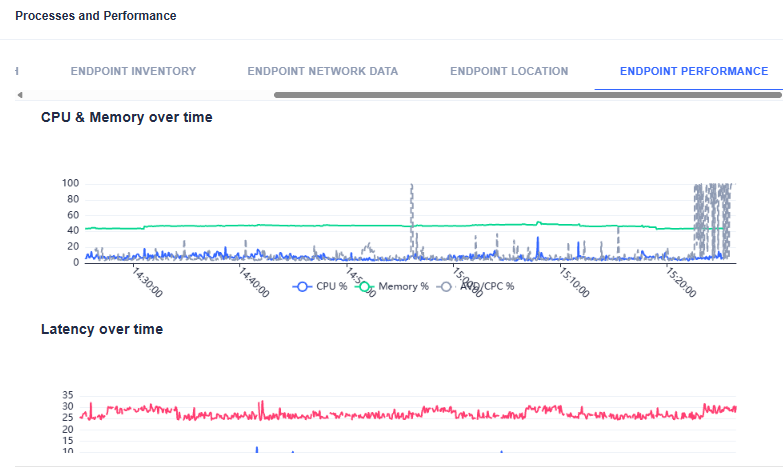
Open Endpoint Performance. Use CPU & Memory over time to see whether endpoint resource usage spiked around the time of a reported issue. Compare the same time window in Latency over time to see whether latency also changed.
To configure a continuous latency ping, pass PINGENABLED=1 and set PINGTARGET to the destination you want to measure, for example PINGTARGET="8.8.8.8". Scroll down to see even more performance-related information.