
Overview
The Azure Virtual Desktop section in Hydra Lens provides information about connections and errors for selected AVD host pools. Here, you can:
-
Apply filters to select a tenant, host pools, and a time period.
-
Monitor the KPIs for the selected AVD environment.
-
Use two tabs with more details:
-
Connections: View session activity and connections by location and user.
-
Errors: View unhealthy session hosts and connection errors by client and IP segment.
-
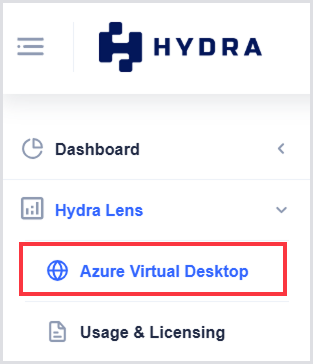
To access the section, navigate to Hydra Lens > Azure Virtual Desktop in the Hydra left-hand menu:
Prerequisites
For data to populate in this page, your Host Pools must have Diagnostic Logging enabled. Diagnostic Logging requires a Log Analytics Workspace to be set up in the same tenant as the Host Pools.
For single-tenant scenarios, you can utilize the Log Analytics Workspace that comes with Hydra. For multi-tenant scenarios, you will need a Log Analytics Workspace setup in each customer tenant. In either case, the tenant’s Service Principal must have the ability to read from the Log Analytics Workspace. This can be accomplished by assigning our custom Hydra - Resource Access Role or Azure’s built-in Log Analytics Reader role.
To enable Diagnostic Logging:
-
Navigate to the Host Pool object in Hydra via Azure Resources > Virtual Desktop.
-
Target the specific Host Pool and select Properties.
-
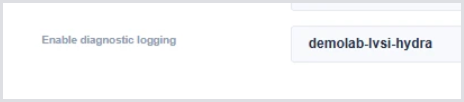
In the initial Configuration tab for the Host Pool, find the Enable diagnostic logging setting and select a Log Analytics Workspace. If none are available, ensure the tenant’s Service Principal has proper access as noted above.
Tip: This can also be accomplished via the Azure Portal.
Filtering AVD Data
Use the filters at the top of the page to specify the AVD data to include in the report. You can filter by:
|
Filter |
Description |
|---|---|
|
Tenant |
Select one tenant. |
|
Host Pools |
Select one or more host pools within the tenant. |
|
Time Period |
Select the period for which you want to view data. |
A tenant can contain multiple host pools with session hosts. Only host pools that have diagnostic logging enabled can provide data for the report.
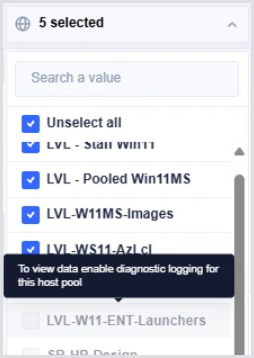
The host pool filter indicates how many host pools have diagnostic logging enabled. Host pools without diagnostic logging can also appear in the list, but you can't include their data in the report.
Note: If you select a host pool that doesn't have diagnostic logging enabled, a tooltip message prompts you to enable diagnostic logging for that host pool before you can view its data. See an example below:
To update the report:
-
Select a tenant.
-
Select the host pools to include.
-
Select a time period.
-
Select Refresh.

The updated page shows data for the selected tenant, host pools, and time period.
KPI Cards
The KPI cards provide a summary of the selected AVD environment.
Note: The KPI cards show the current state of the environment rather than values aggregated over the selected time period.
The following KPI cards are available:
|
KPI |
Description |
|---|---|
|
Host Pools |
The number of host pools |
|
Session Hosts |
The total number of session hosts. |
|
Unhealthy Session Hosts |
The number of session hosts that are currently unhealthy. |
|
Orphaned Session Hosts |
The number of orphaned session hosts. |
|
Average Logon Timing |
The average logon time for the selected data and time period. |
|
Host Pools with Diagnostic Logging |
The number of selected host pools that have diagnostic logging enabled. |

Connections
Use this tab to review session activity and user connections. The tab contains the following sections:
Number of Sessions (Active & Inactive)
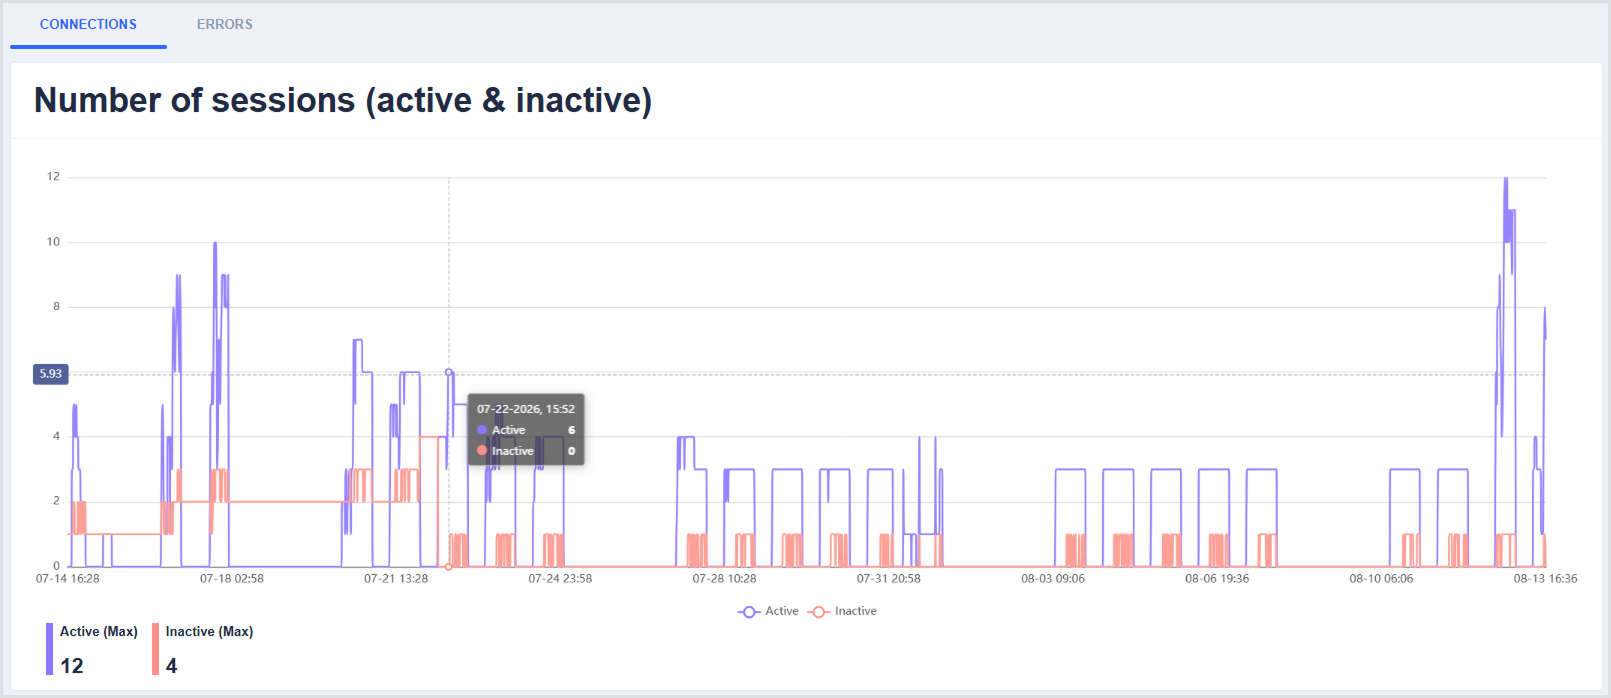
The chart shows the number of active and inactive sessions over the selected time period.
Hover over the chart to view the number of active and inactive sessions at a specific timestamp.
The chart also shows the maximum number of active sessions and the maximum number of inactive sessions for the selected time period.
Sessions by Location and User
The table shows where users connected from and how many connections they made during the selected time period. The table includes the following columns:
|
Column |
Description |
|
Tenant |
The tenant associated with the connection. |
|
User Name |
The user associated with the connection. |
|
Country |
The country associated with the connection. |
|
City |
The city associated with the connection. |
|
Connections |
The number of connections for the user during the selected time period. |
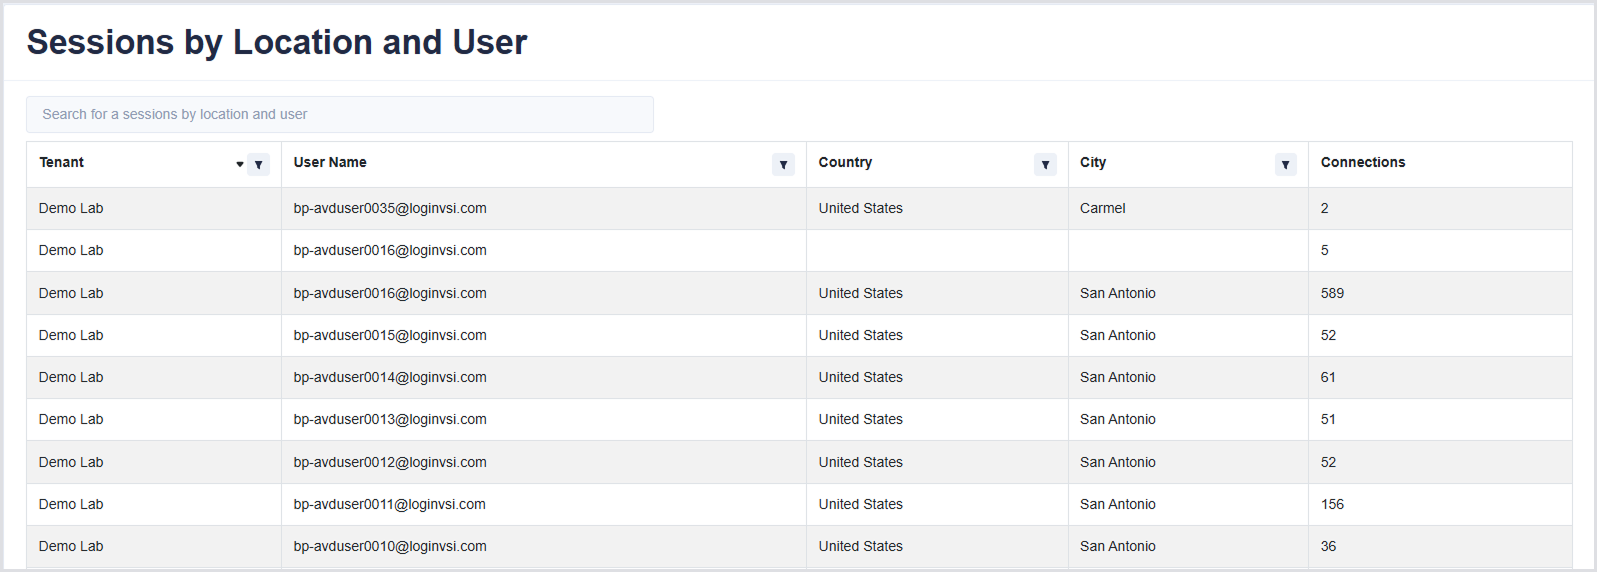
You can:
-
Sort the table by any column.
-
Filter the table by column values.
-
Search the table.
For example, you can filter the table to view users from a particular city, filter for a specific user, or review how many times a user connected during the selected time period.
Errors
Use this tab to review unhealthy session hosts and connection errors. The tab contains the following sections:
Unhealthy Session Hosts
The table lists session hosts that have an error state. It includes the following columns:
|
Column |
Description |
|
Tenant |
The tenant associated with the session host. |
|
Host Pool |
The host pool that contains the session host. |
|
Session Host |
The session host with the error state. |
|
Date/Time |
The date and time associated with the error. |
|
Message |
The error message associated with the session host. |
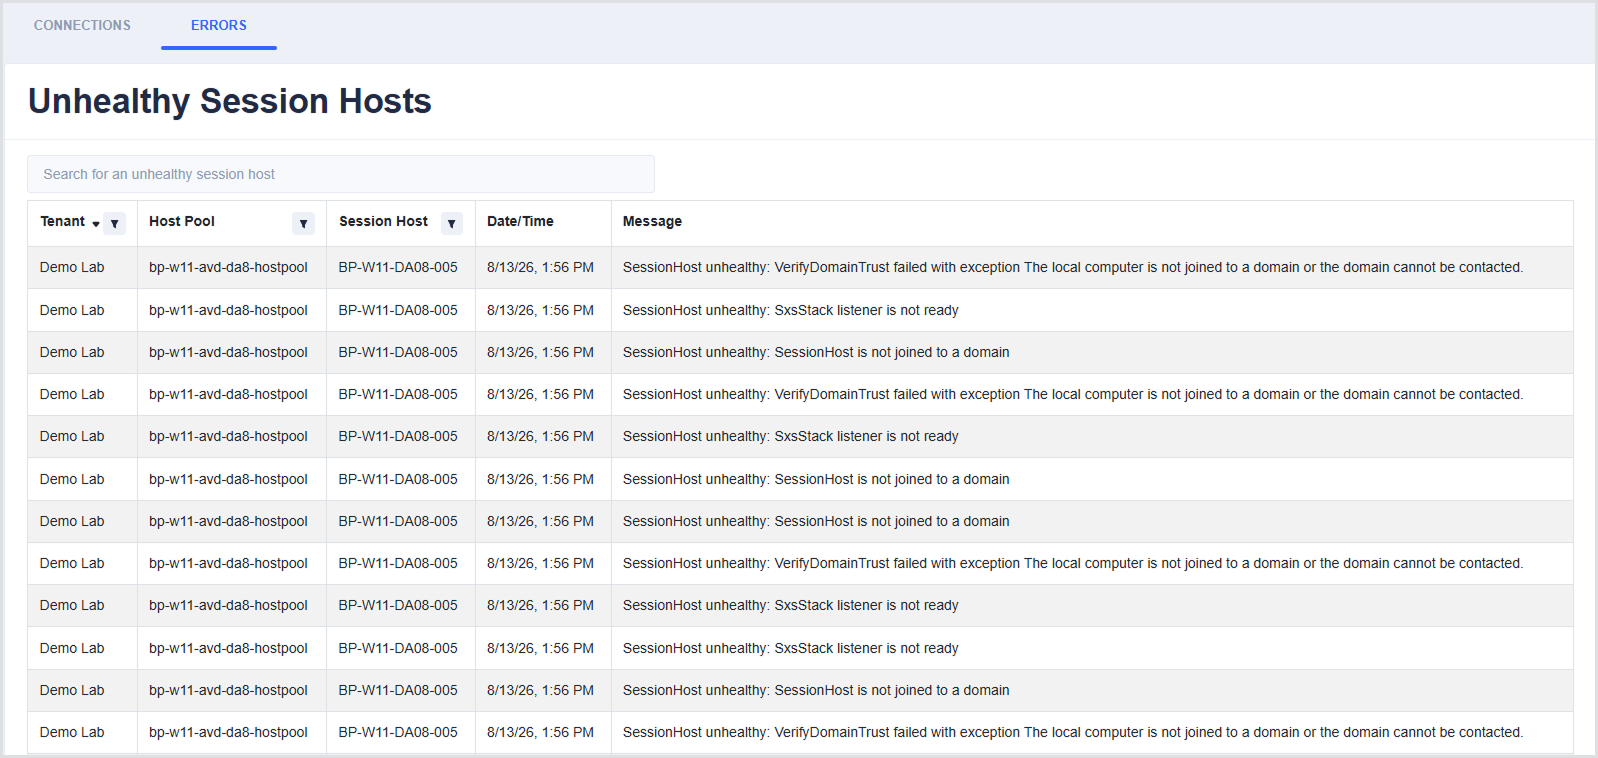
You can filter the table by tenant, host pool, session host, or message. You can also sort the entries by time.
Use the pagination controls to move through additional results.
Errors by Client
The table shows connection success and error information for the clients used to connect to session hosts. Clients can include Remote Desktop Connection, the Windows 365 connector, or a web connector. The following columns are available:
|
Column |
Description |
|
ClientType |
The type of client used to connect to the session host. |
|
ClientVersion |
The version of the client. |
|
Success |
The number of successful connections. |
|
Errors |
The number of connection errors. |
|
Error Rate |
The error rate for the client type. |
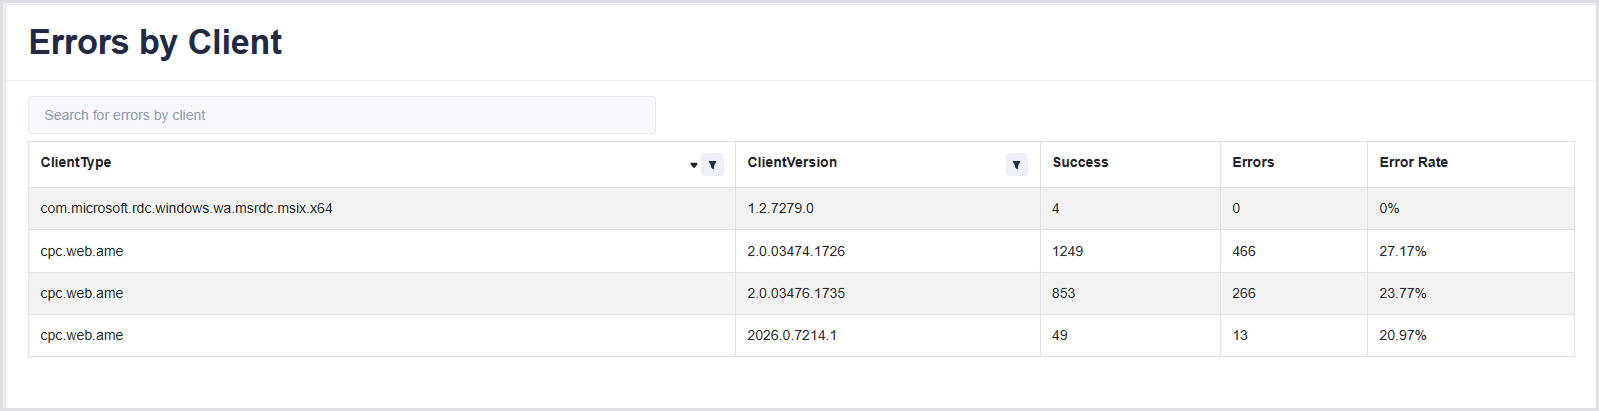
You can sort and filter the table to investigate connection errors for particular client types or versions.
Errors by IP Segment (Class C)
The table shows connection success and error information by Class C IP segment. Use this information to identify IP segments with higher error rates. The table includes the following columns:
|
Column |
Description |
|
IP Segment (C) |
The Class C IP segment associated with the connections. |
|
Success |
The number of successful connections. |
|
Errors |
The number of connection errors. |
|
Error Rate |
The error rate for the IP segment. |
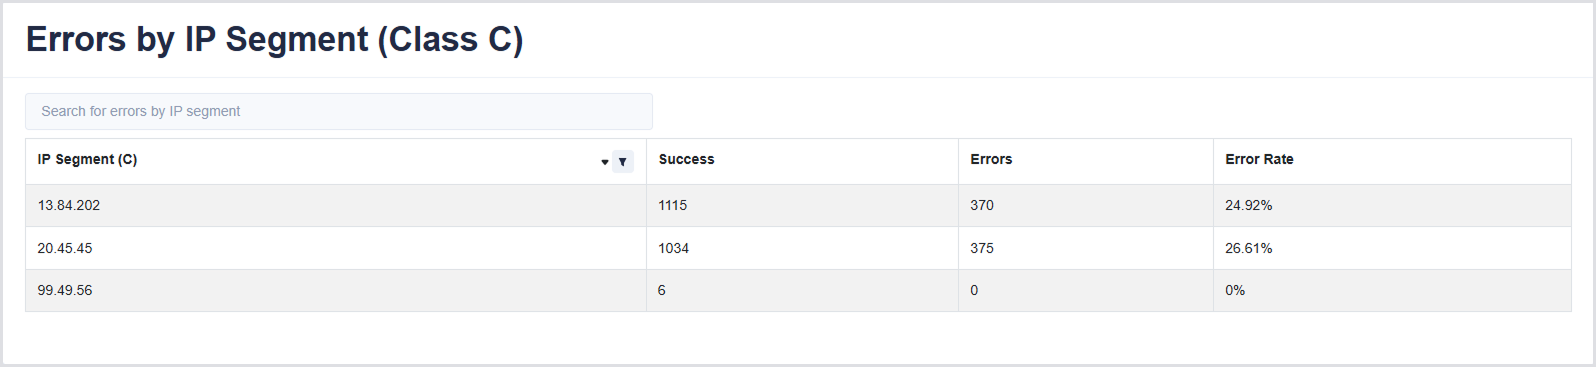
You can sort and filter the table to investigate errors for particular IP segments.
Network Performance
Use this tab to review network performance reports. The tab contains the following sections:
Network Performance by User
This table shows network latency and estimated bandwidth per user session. Use this information to identify potential performance issues users may be experiencing. The table includes the following columns:
|
Column |
Description |
|
User Name |
The user associated with the session |
|
Protocol |
The network protocol established for this session |
|
Avg. RTT |
The average Round Trip latency in milliseconds (ms) |
|
Max. RTT |
The maximum Round Trip latency in milliseconds (ms) |
|
P90 RTT |
The 90th percentile Round Trip latency in milliseconds (ms) |
|
Avg. Bandwidth |
The average, estimated throughput in megabits per second (Mbps) |
|
Max. Bandwidth |
The maximum, estimated throughput in megabits per second (Mbps) |
|
P90 Bandwidth |
The 90th percentile, estimated throughput in megabits per second (Mbps) |
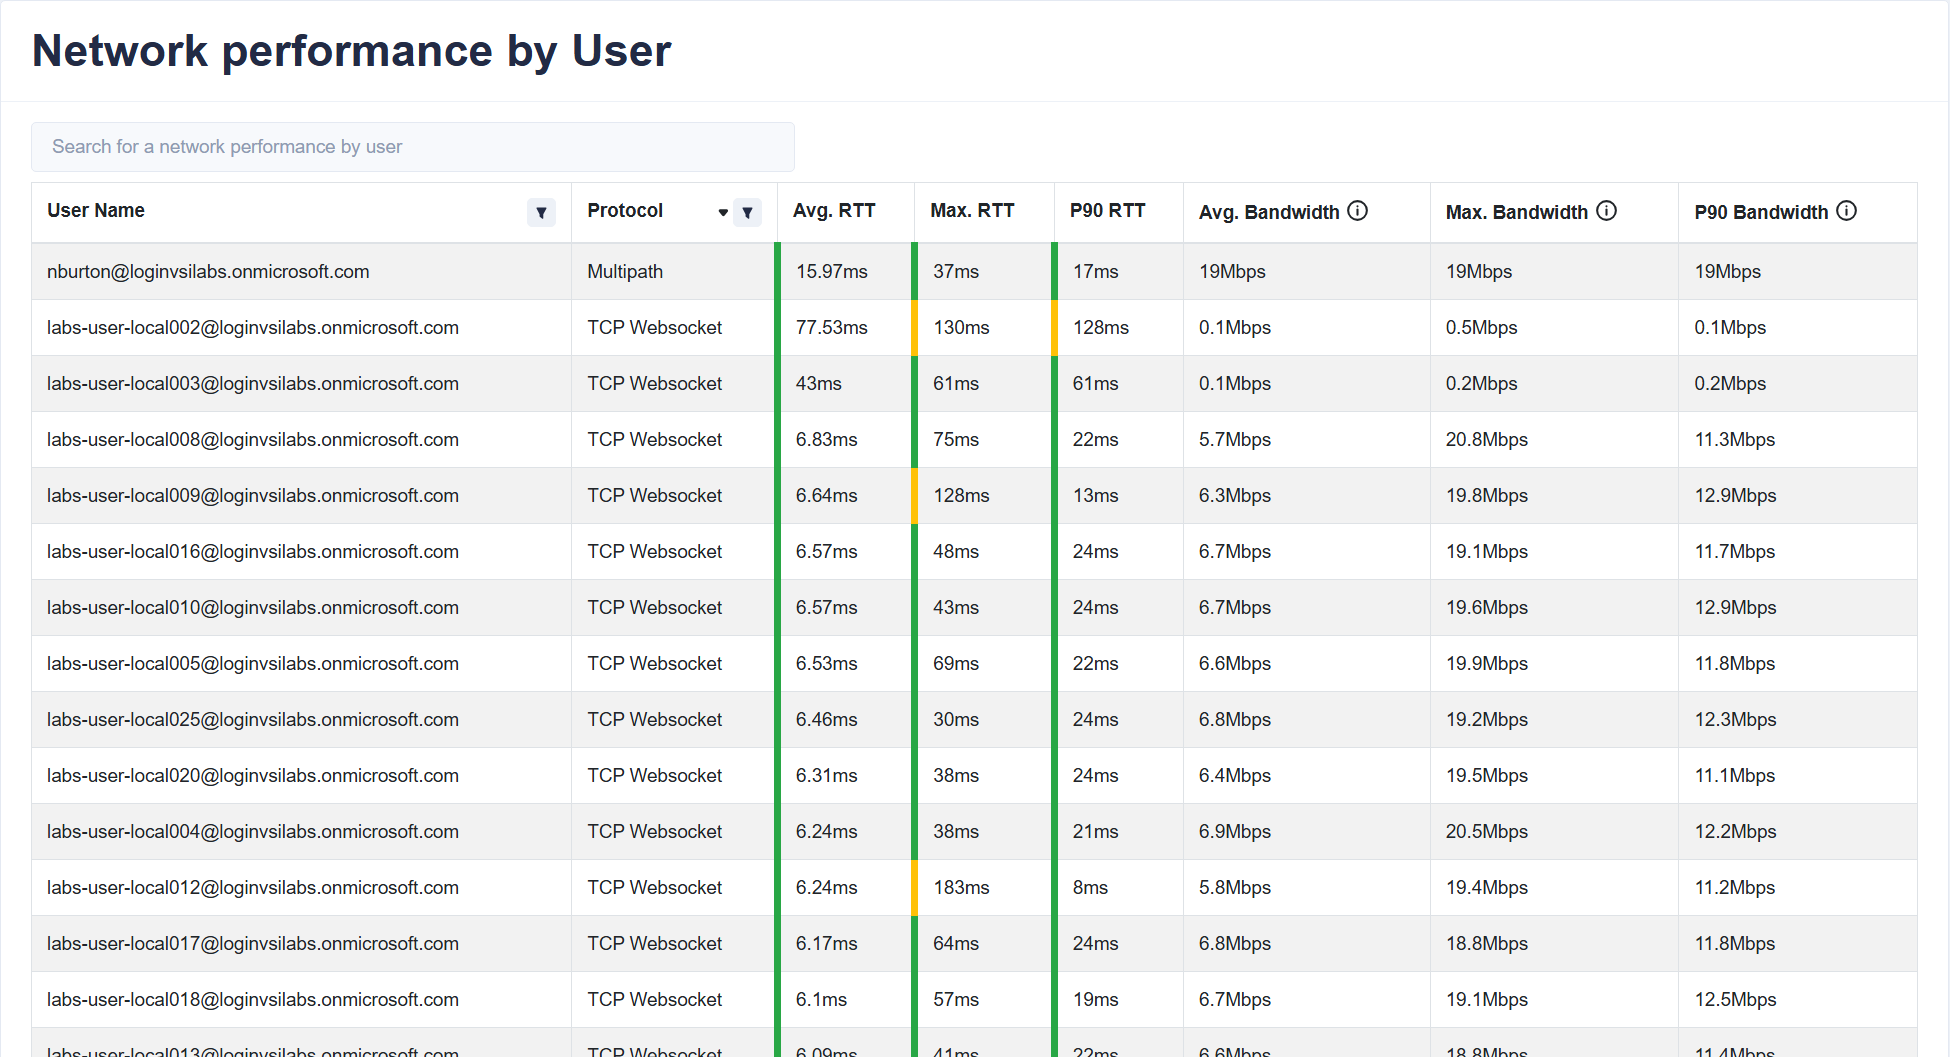
You can sort and filter the table to investigate the performance for specific users.