Overview
You can view the results of individual Continuous Tests and compare up to five Continuous Test instances. The Continuous Test Results page provides a comprehensive overview of measurements, including charts, graphs, and detailed events for each Test. You can configure and download SLA reports and view Events. You can also download single Test results as PDF reports for easy sharing and analysis. See the instructions below for more details.
Single Test
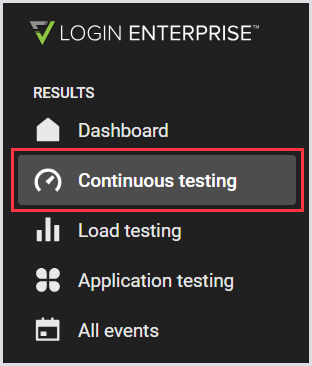
You can start looking at the Continuous Test results at any time. For this, in the Login Enterprise sidebar menu > Results, navigate to Continuous testing.
Single Test Summary
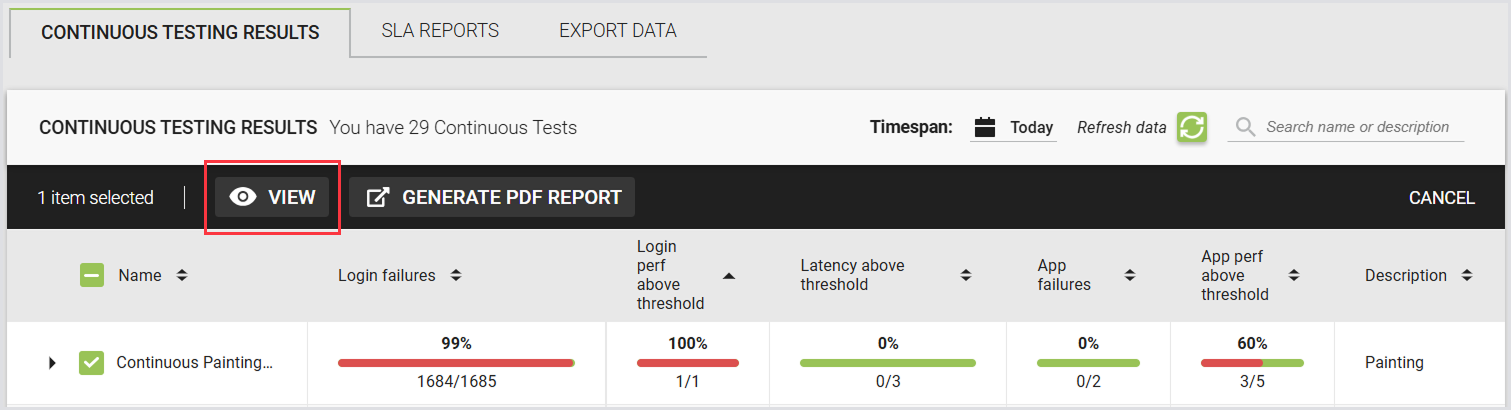
This page displays a list of previously executed Continuous Tests. The table is sorted by default on “Login failures,” and includes the following:
Note: An info box at the top of the page includes a link to the previous (legacy) results page for reference.
|
Name |
Login failures |
Login performance above threshold |
Latency above threshold |
Application failures |
App performance above threshold |
Description |
|---|---|---|---|---|---|---|
|
Name and sequence number of the Test. |
Number of login failures (displayed as x out of y) and corresponding percentage. |
Indicates how many login performance measurements exceeded the defined threshold. |
Shows how many latency measurements exceeded the acceptable threshold. |
Number of application-level failures detected during test execution. |
Number of application performance metrics exceeding defined thresholds. |
Description defined in the test configuration. |
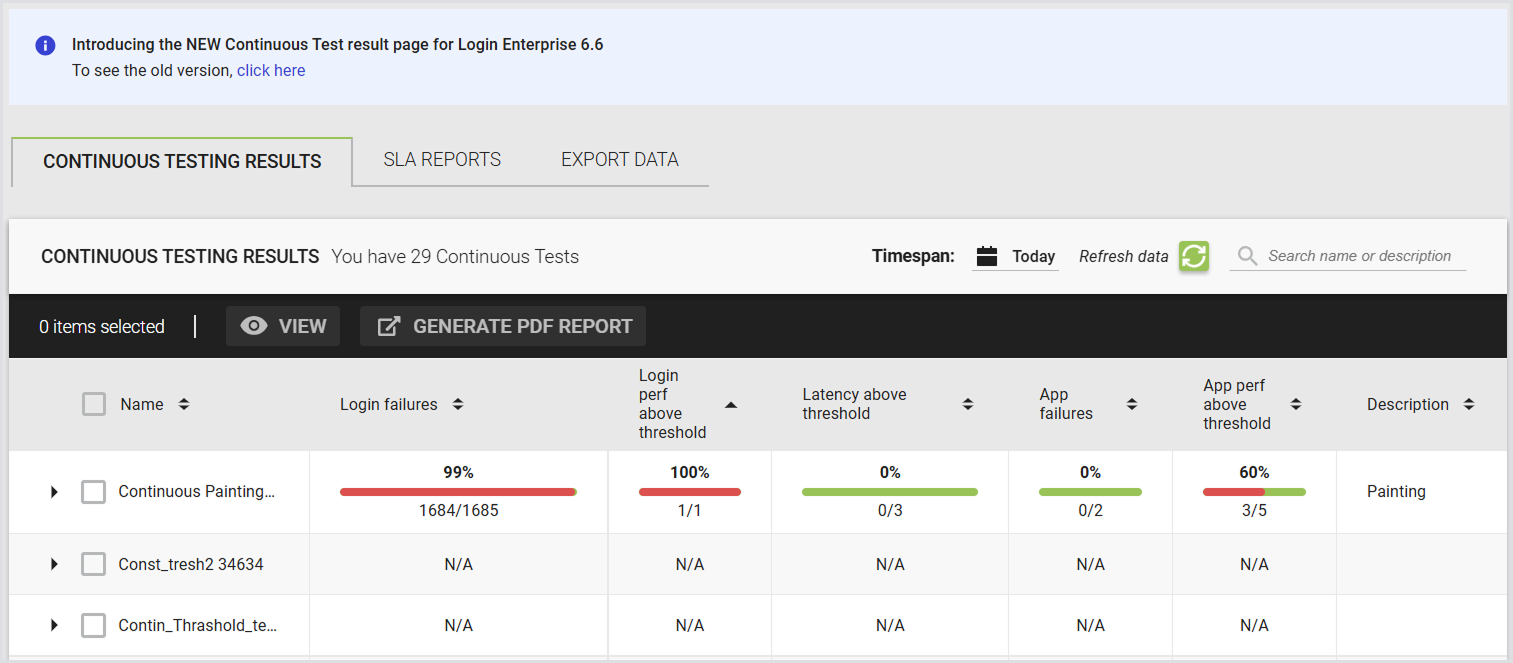
All results displayed on the page are filtered based on the selected time span. Use the date picker in the top right corner to select any time range. Default setting: Last 1 hour.
Note: If the selected time span includes a future time range, a Refresh button appears on the Overview page and Result pages. Click Refresh to reload the page and update the results with the latest available data.
Search results dynamically filter the table content. Use the search field to find tests by Test Name and/or Description.
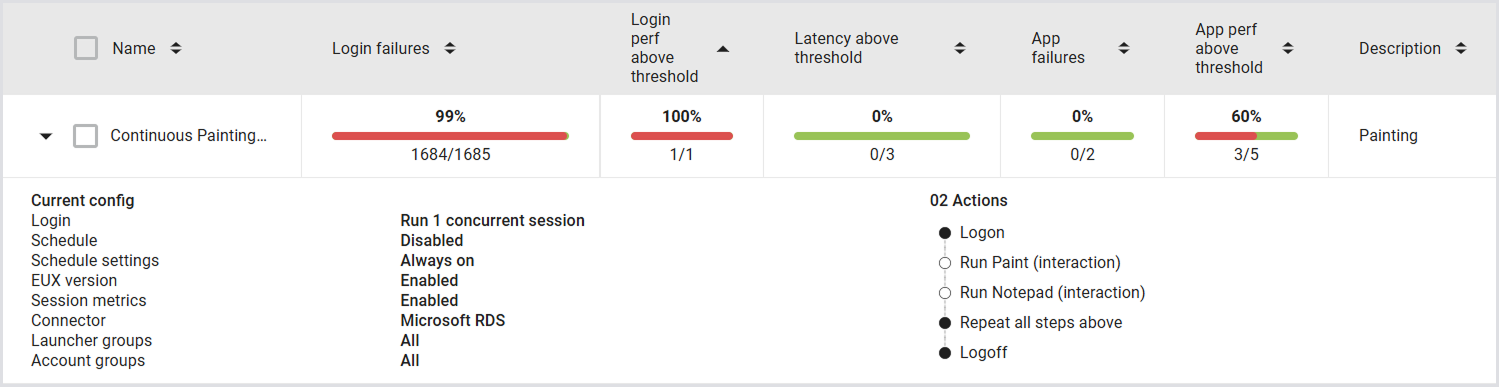
Tip: Click on a test to open its details and review the current test configuration. Historical configurations are not shown.
There are two additional tabs available for extended functionality:
-
SLA Reports
-
Export Data
See the SLA Reports and Export Data sections for details.
Single Test Results
To view the test results for a single test, select a test and click View.
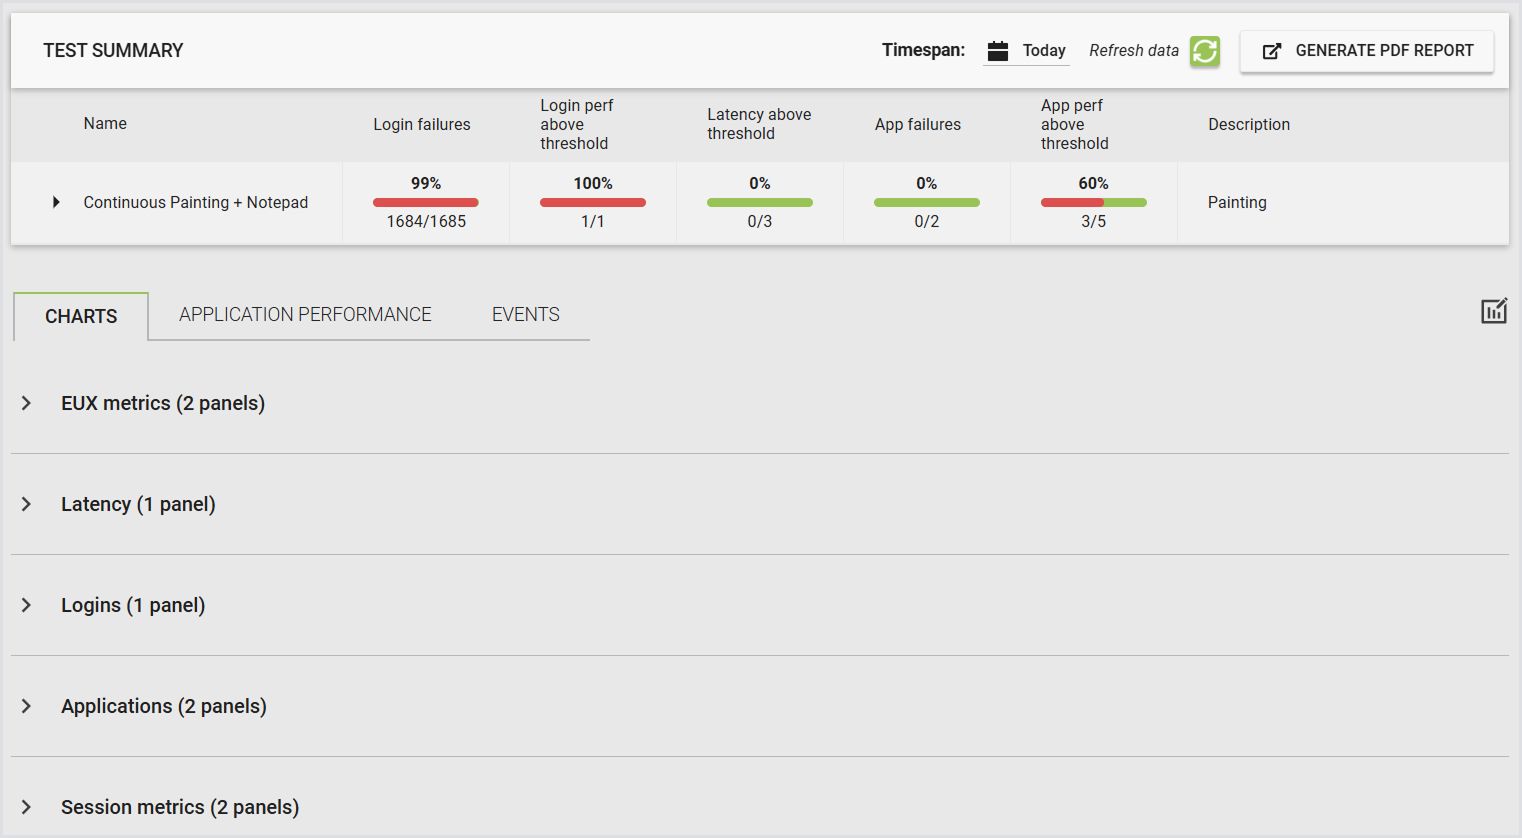
The following page displays the Test summary, Charts (EUX metrics, Latency, Logins, Applications, and Session metrics), Application Performance, and Events.
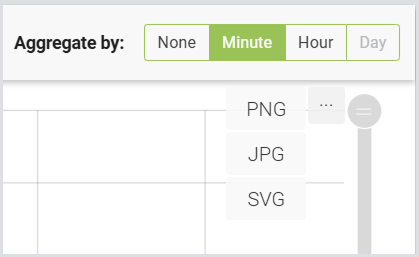
For the Charts section, you can select any time span using the date picker. Based on the selected time span, different aggregation options are available. For details, see Aggregation options.
Note: If the selected time span includes a future time range, a Refresh button appears on the Overview page and Result pages. Click Refresh to reload the page and update the results with the latest available data.
Application Performance
Note: This feature is available only in the Single Test view. It isn't yet available in Compare.
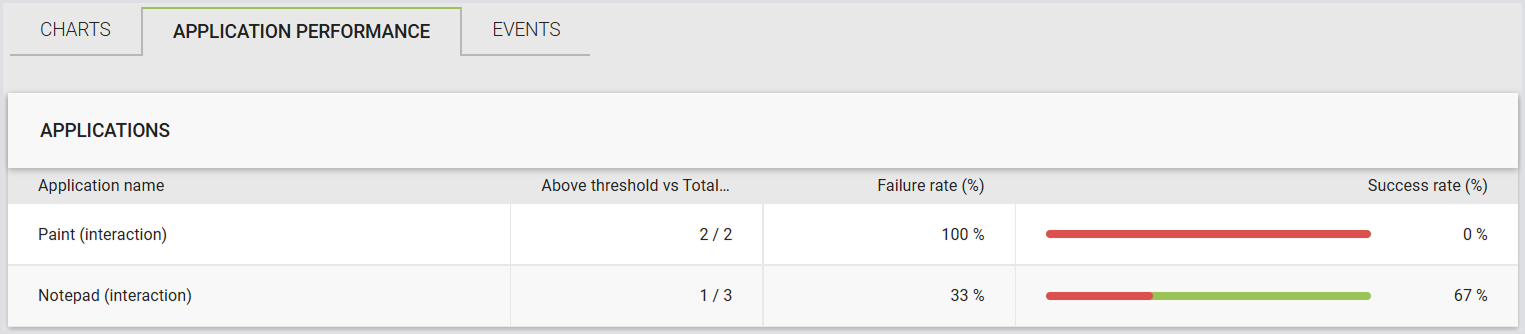
Use the Application performance tab to review performance details for applications in a Continuous Test result. The tab shows a list of applications included in the test. For each application, you can review:
-
Above-threshold measurements compared with total measurements
-
Failure rate
-
Status bar showing failed and successful measurements
-
Success rate
Select an application to open the application details page.
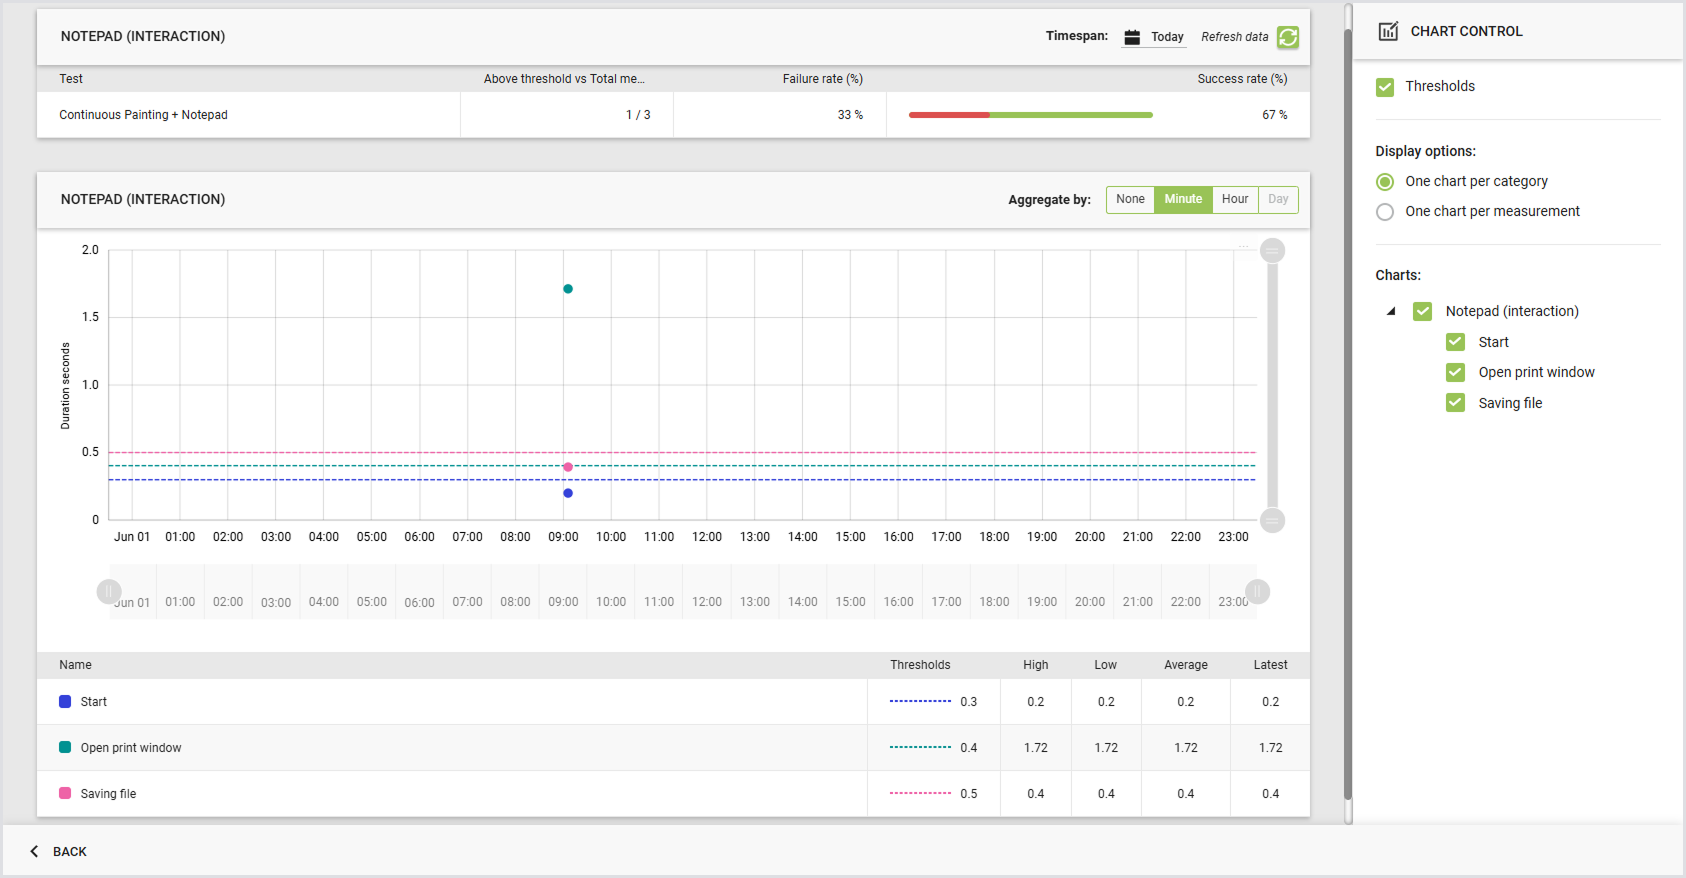
The application details page shows performance data for the selected application. The statistics table includes:
-
Above-threshold measurements compared with total measurements
-
Failure rate
-
Status bar showing failed and successful measurements
-
Success rate
Select the row in the statistics table to open the related events list.
Note: The event list shows only events of type Application Threshold exceeded.
The application details page also includes charts that show measurements for the selected application.
Tip: To change the time span, go back to the previous (Test Results Overview) page.
Generating a Test PDF Report
You can generate a single Continuous Test PDF report at any time. To generate the report:
-
In the Continuous Testing results, select the checkbox next to the test you’re interested in.
-
Click Generate report in the top menu toolbar.
-
In the Generate PDF report pop-up, configure the report according to your needs by ticking off the info you want to include. For details and examples, see Configuring a Test PDF report.
-
Click Generate, and then Save.
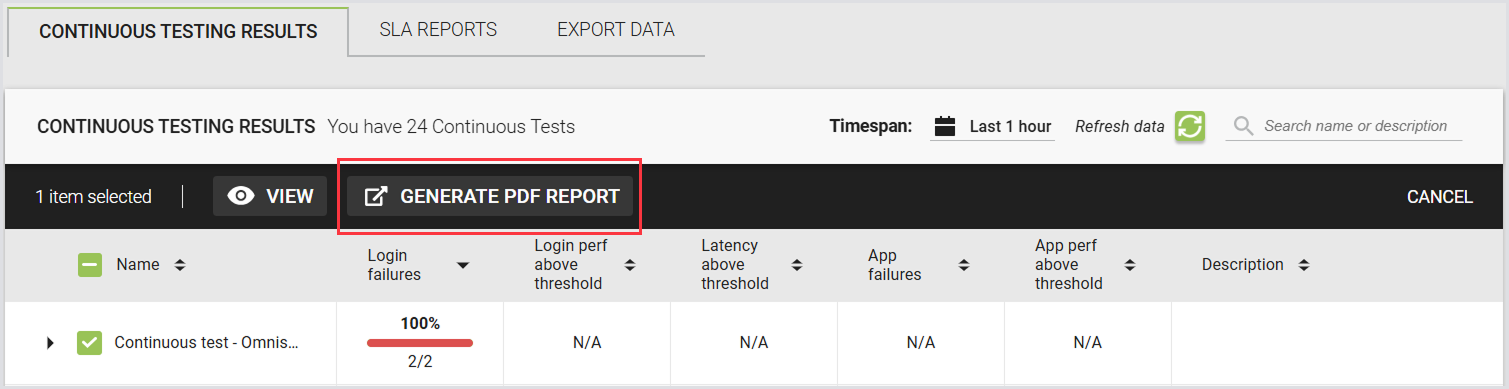
To learn about what the Test PDF report consists of, see the Test PDF Report Breakdown.
Compared Tests
Compared Test Summary
This page displays a list of compared Continuous Tests. The information you’re viewing is the same as in the single Continuous Test summary. For details, see the Single Test Summary.
Compared Test Results
To view the test results for the compared tests, select up to 5 tests and click Compare.
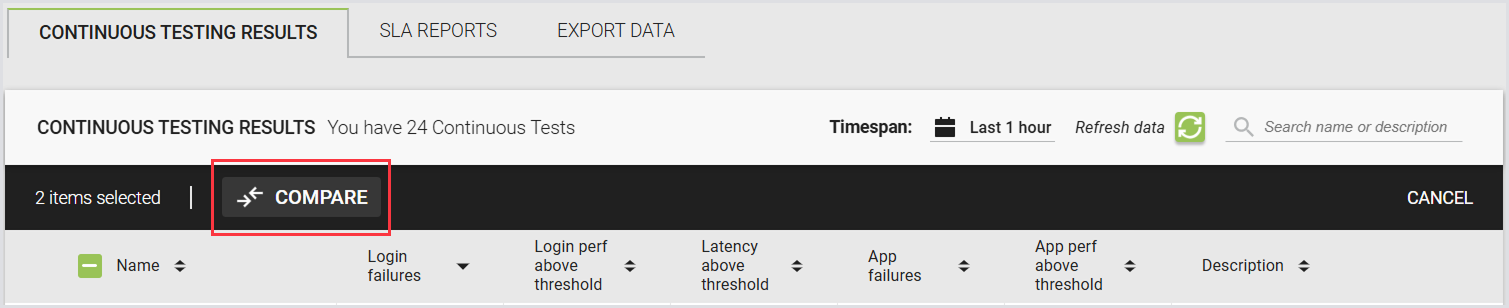
The following page displays the Test summary, Charts (EUX metrics, Latency, Logins, Applications, and Session metrics), and Events.
For the Charts section, you can select any time span using the date picker. Based on the selected time span, different aggregation options become available. For details, see Aggregation options.
Aggregation Options
|
Time Span |
Available Aggregations |
Default Aggregation |
Disabled (Greyed Out) |
|---|---|---|---|
|
< 2 hours |
None (raw data), Per minute |
None (raw data) |
Per hour, Per day |
|
2–24 hours |
None (raw data), Per minute, Per hour |
Per minute |
Per day |
|
24 hours - 1 month |
Per hour, Per day |
Per hour |
None, Per minute |
|
> 1 month |
Per hour, Per day |
Per day |
None, Per minute |
Note: Available aggregation options dynamically adjust based on the selected time span. Unavailable options are visible but disabled (greyed out).
EUX Metrics
This is where you can see the EUX score and EUX timers. Available EUX timers:
-
Generic Applications score
-
CPU score
-
My Documents I/O score
-
Local AppData I/O score
-
Mixed CPU I/O score
-
User input score
Here’s an example of an EUX score chart:
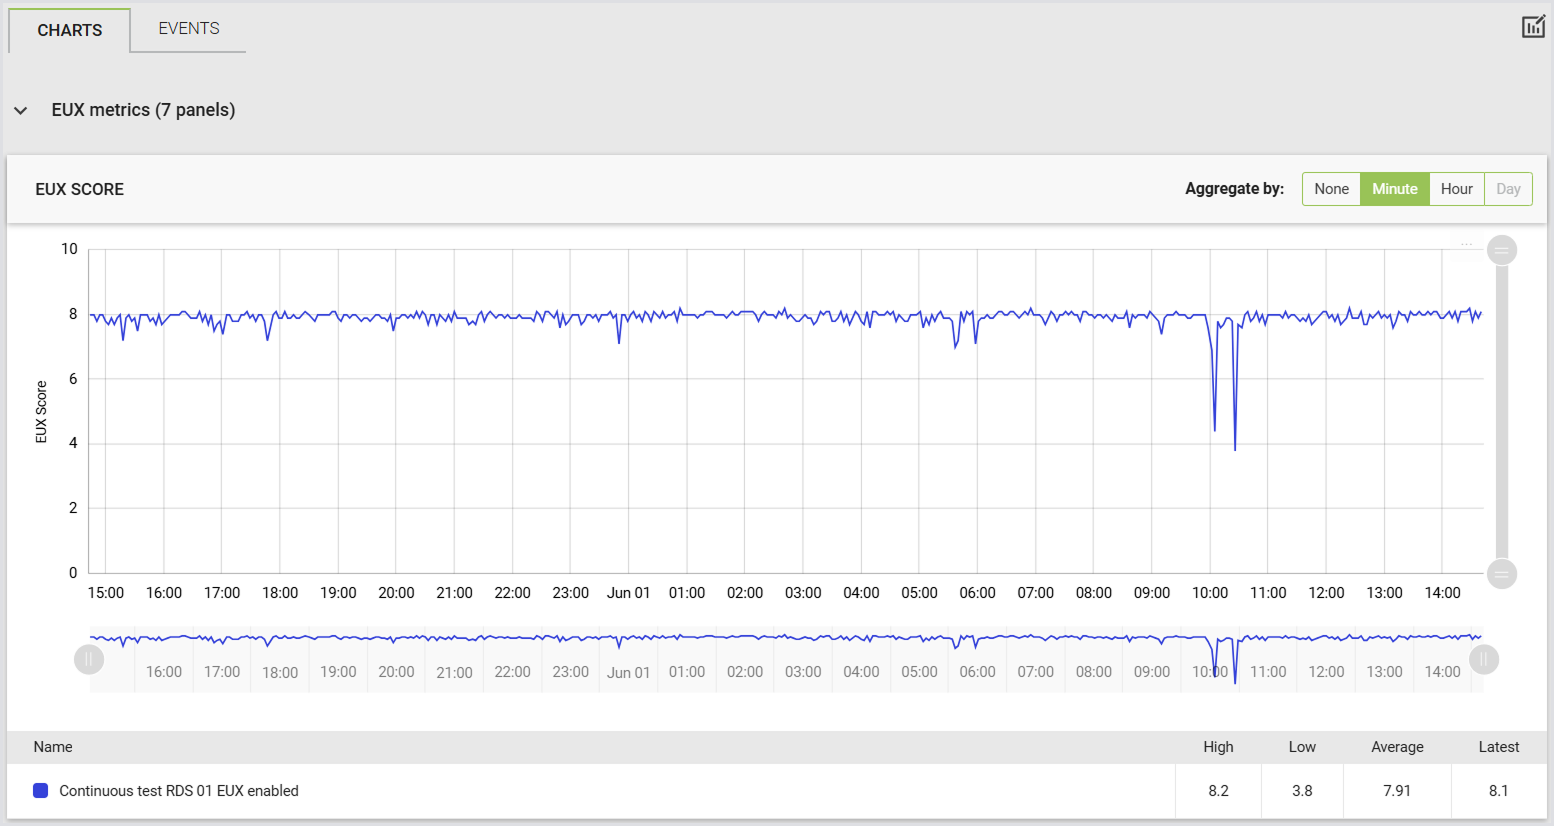
For more information on the EUX score, see Calculating the EUX score and VSImax.
Latency
This is where you can see the latency metrics.
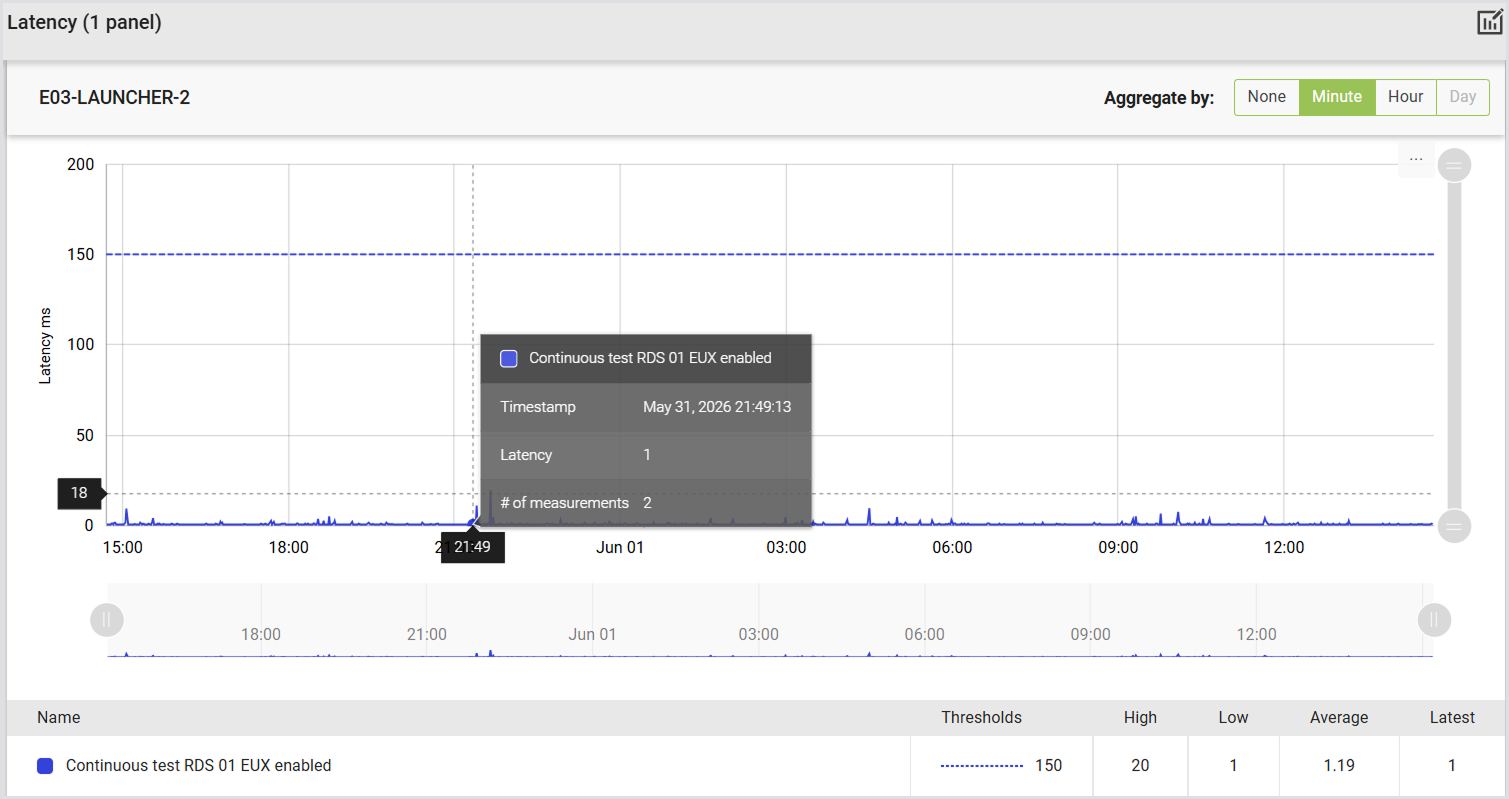
To learn more about latency, see Monitoring Latency.
Logins
This is where you can see login performance metrics, such as:
-
Display Protocol Connection
-
Profile load
-
GPO Processing
-
Total login time
Here’s an example of a Profile Load chart:
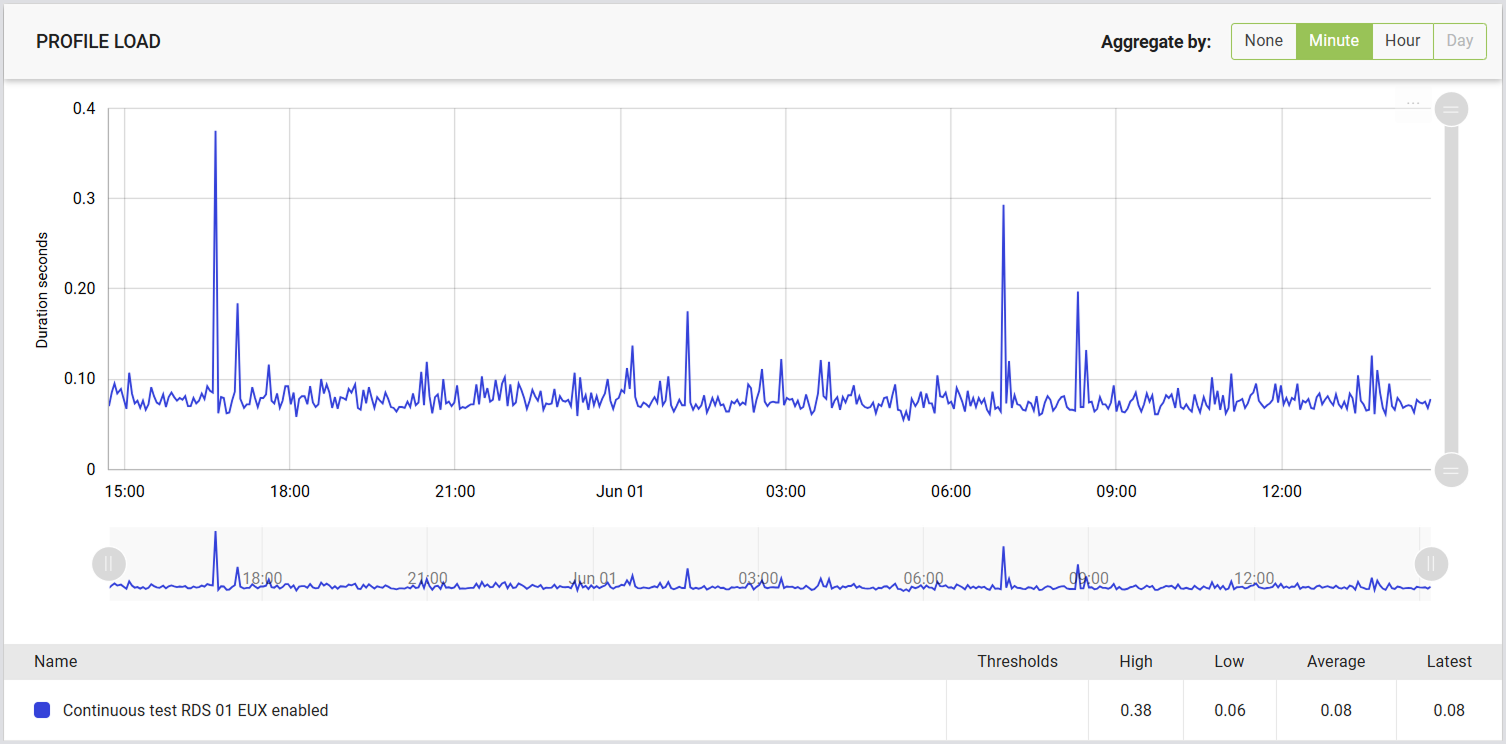
For more information on login performance, see Monitoring Login Performance.
Applications
This is where you can analyze application performance metrics, such as start times and Virtual User workload functions.
Here’s an example of a start time chart:
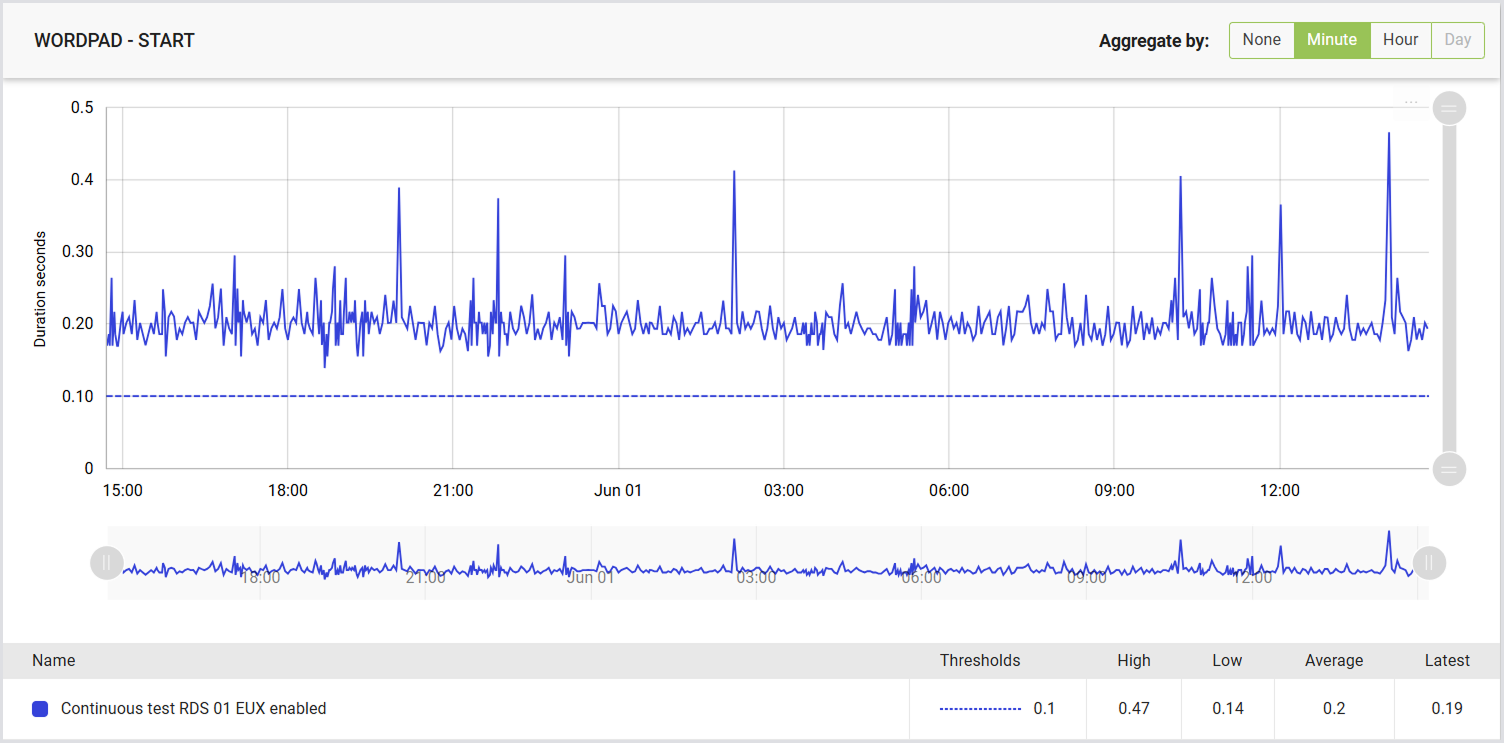
For details on Applications, see Configuring Applications for Testing.
Session Metrics
This is where you can view session metrics, such as CPU and Memory.
Here’s an example of a CPU chart:
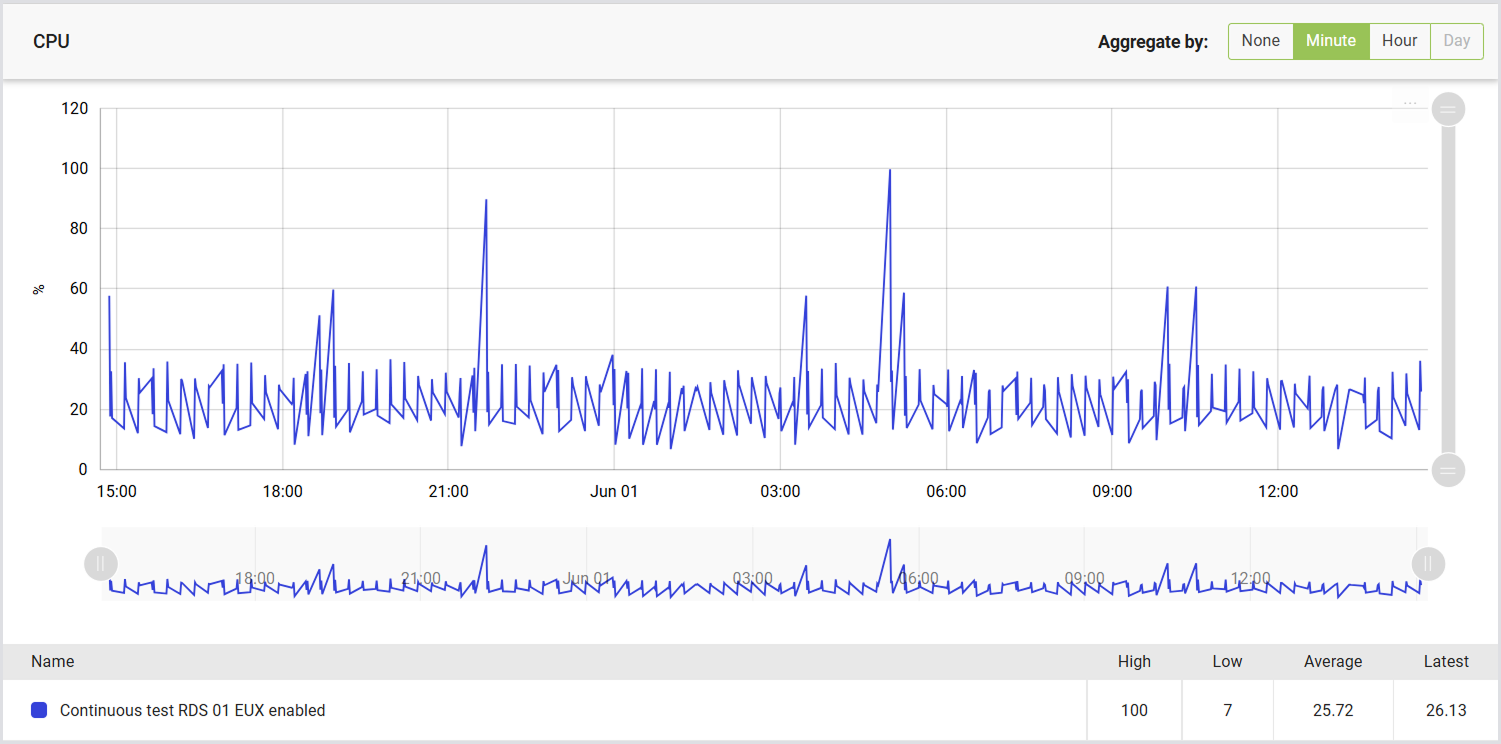
To learn more about Session Metrics, see Managing Session Metrics. For general guidelines on how to analyze Continuous Testing Session Metrics, refer to Viewing Session Metrics.
Events
The Events tab includes events related to Continuous Test and system events. To access Events:
-
In the Login Enterprise sidebar menu, navigate to Results > Continuous testing.
-
Select the test you’re interested in, click View, and then select Events from the tab menu.
The Events table lists all recorded events:
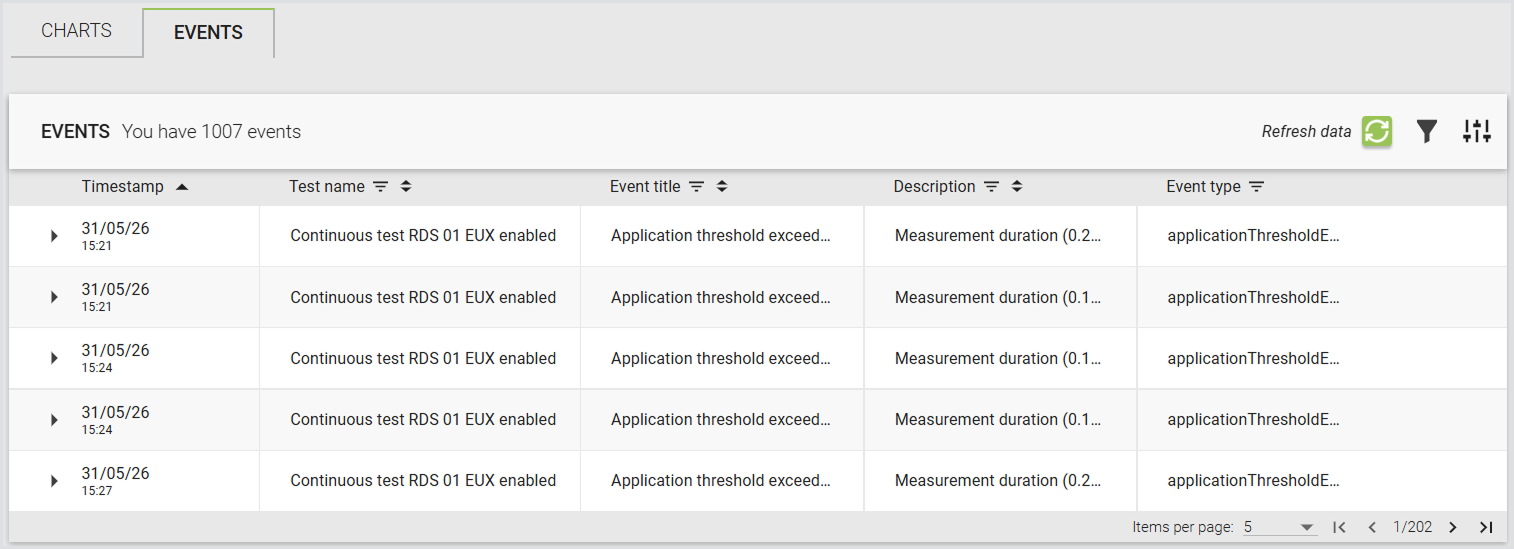
-
Click an event to view more detailed information:
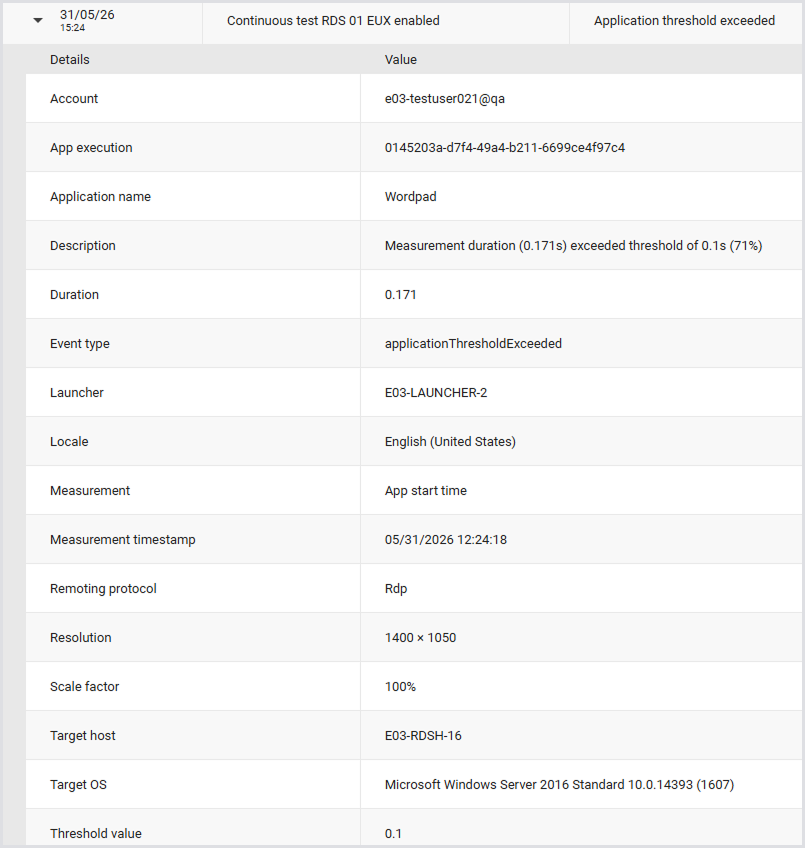
Tip: If available, click on the Screenshot icon to the right of the event for more details about an application that failed. Click on the Download icon to download the script log.
Time Span Selection
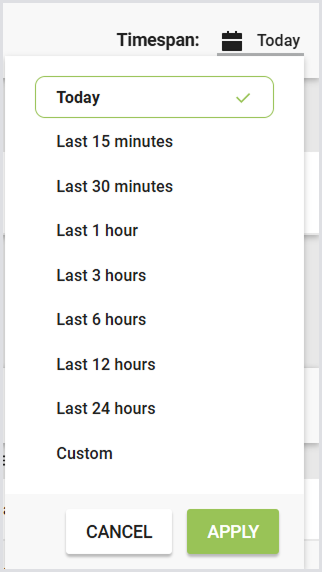
You can select a custom time span to view events. The date picker includes quick-select options:
-
Today
-
Last 15 minutes
-
Last 30 minutes
-
Last 1 hour
-
Last 3 hours
-
Last 6 hours
-
Last 12 hours
-
Last 24 hours
Custom Time Span
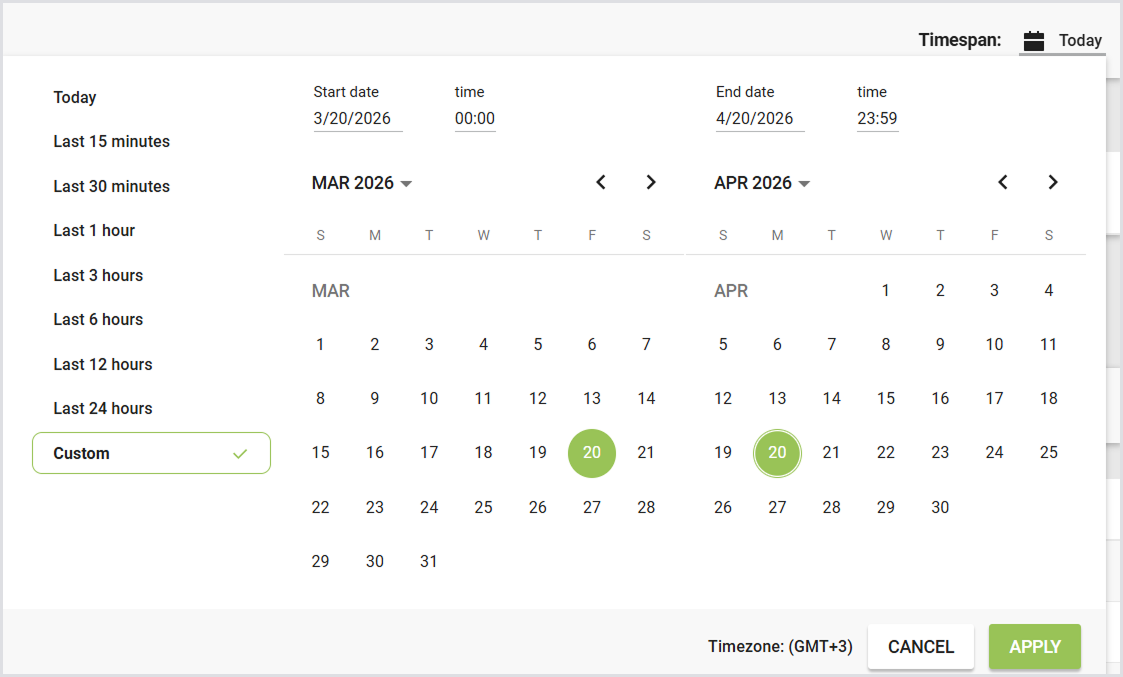
To select a custom time span:
-
Choose Custom in the date picker.
-
Use the From and To fields or the calendar view to select a start and end date.
-
Click Apply.
By default, the page shows events for Last 1 hour. When you change the time span, your selection is saved in the browser. Returning to the page will display your previously selected time span.
Live Updates
The page automatically updates with new events:
-
If you select a quick option like Today, new events appear immediately in the list.
-
If you select a time span such as Last 15 minutes or Last 1 hour, new events are added automatically, and the time span updates to include the new events.
Tip: A search field above the table allows you to filter events by Test name. This makes it easier to locate specific events quickly.
Possible Events
-
accountCapacityExceeded -
accountDisabled -
appExecutionAbandoned -
applicationFailure -
applicationThresholdExceeded -
connectionInitializationTimeout -
customUserSessionEvent -
dataRetentionFailed -
dataRetentionFinished -
dataRetentionStarted -
databaseFailure -
emailFailure -
emailRequest -
emailSent -
engineLogs -
enginePaused -
engineResumed -
euxExecutionFailure -
euxInitializationFailure -
latencyMeasurementFailed -
latencyThresholdExceeded -
launcherCapacityExceeded -
launcherLogs -
launcherOffline -
licenseSessionLimit -
loginFailure -
loginTimeMeasurementFailed -
loginTimeThresholdExceeded -
remoteSessionDisconnected -
screenshotFailure -
scriptEvent -
scriptScreenshot -
sessionDiscoveryError -
sessionFailure -
sessionRequestEndedBeforeEngineBecameOnline -
testRunCancelled -
testRunFailed -
testRunFinished -
testRunStarted
Configuring a Test PDF Report
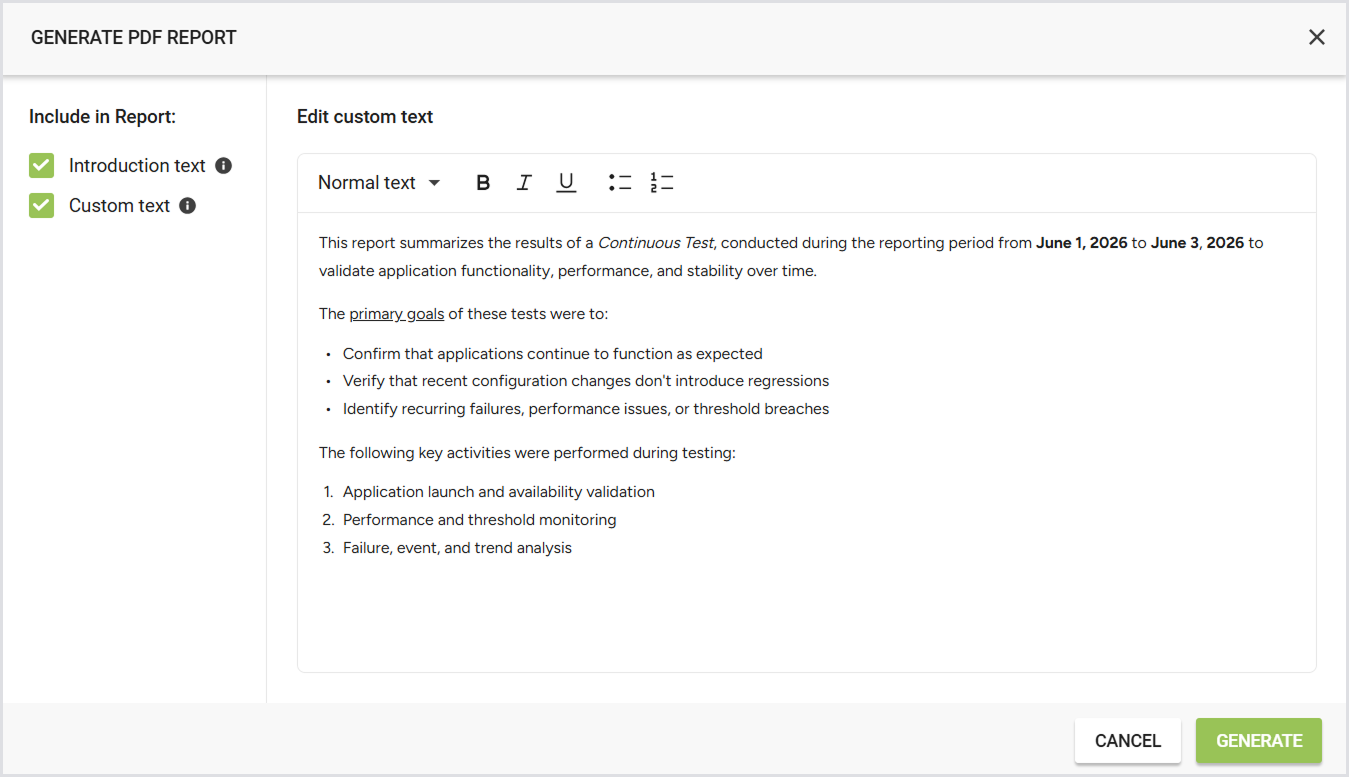
You can choose what you would like your Continuous Test PDF report to include. Once you click Generate PDF report, you can configure the following:
|
Setting |
Description |
Options / Details |
Notes |
|---|---|---|---|
|
Introduction text |
Include general information about Login Enterprise at the beginning of the report. |
|
- |
|
Custom text |
Add your own text to the PDF report. Useful for describing what was tested, why, or summarizing conclusions. |
|
|
Test PDF Report Breakdown
The Test PDF report summarizes the findings obtained from the testing process. It provides an overview of the Test specifics, results, and measurements. The report is divided into the following sections:
-
Test details section: Shows the current configuration of the test.
-
Environment summary
-
A table that shows the failure and success rates for logins, login performance, and latency performance
-
A chart that shows the success rates of all 3 measurements over time
-
Logins
-
Login performance
-
Latency performance
-
-
-
Application summary
-
A table that shows the failure and success rates for application execution and performance
-
A chart that shows the success rates of the 2 measurements over time
-
Application execution
-
Application performance
-
-
-
EUX score
-
2 charts with the results of the EUX measurements of the selected time span.
-
EUX score
-
EUX timers
-
-
-
Logon time
-
A table that shows the failure and success rates for the logon time. It contains one row for the total logon time.
-
A chart that contains the login-related measurements over time.
-
-
Latency performance
-
A table that shows the failure and success rates for the latency (of all launchers).
-
A graph that shows the latency results over time for each launcher.
-
-
Application performance
-
A table with all applications in the test. For each application, the table shows failure and success rates at the application level.
-
-
Application details: Detailed results for each application
-
A table that shows failure and success rates for each measurement within the application.
-
Chart(s) that show the results of each measurement over time.
-
-
Session metrics
-
Each session metric has its own chart.
-
SLA Reports
SLA reporting provides a concise and straightforward document that delivers key performance information. These reports are generated from historical data gathered by Login Enterprise during its operational processes, making them ideal for monitoring service-level agreements, understanding infrastructure performance over time, and facilitating operations reporting to management and service customers.
Benefits of SLA reporting
|
Benefit |
Explanation |
|---|---|
|
Automated history of Test Results |
SLA reports provide a clear and automatically generated history of test scenario results, making it easy to review and analyze past performance. |
|
Multiple email recipients |
Allows the distribution of results to multiple stakeholders. For example, an IT manager can quickly review the overall health and ROI indicators through a PDF attachment, while Login Enterprise administrators can focus on specific details relevant to their responsibilities within the same email. |
|
Simplified review process |
SLA reports are designed to be easy to read, streamlining the process of reviewing results within a defined time frame. This simplifies the task compared to examining Continuous test results and charts directly in the UI. |
Configuring SLA Reports
-
To create a new report, in the Login Enterprise sidebar menu, navigate to Results > Continuous Testing.
-
In the Continuous Testing results, select SLA Reports from the tab menu.
-
In the SLA reports, click the green "+" in the upper-right corner to add a new SLA report:

-
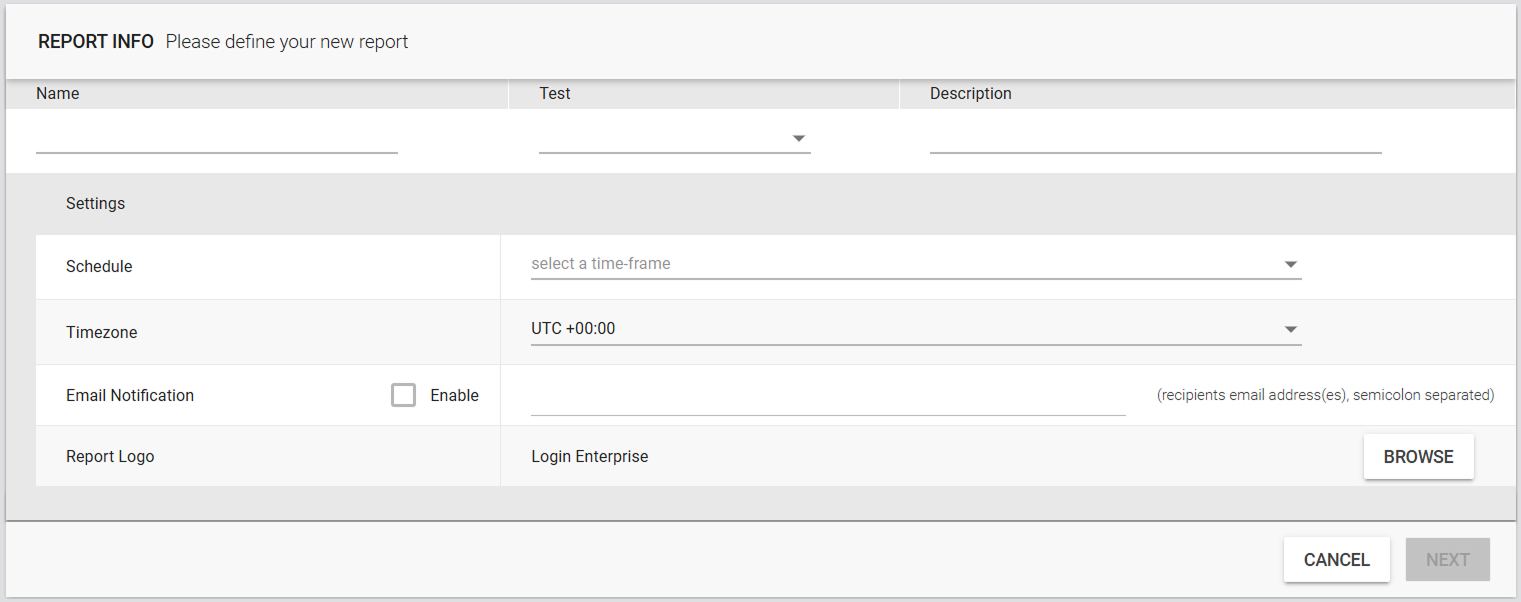
Configure the SLA report with the following settings:
|
Report info |
||
|---|---|---|
|
Name |
Test |
Description |
|
The name of the SLA report. |
The test for which the SLA report will be generated. |
A description of the SLA report. |
|
Settings |
||
|
Schedule |
The time frame for generating the report, e.g., Daily, Weekly, or Monthly. |
|
|
Time zone |
The time zone in UTC format. |
|
|
Email notification |
Enable email notifications and enter the email addresses that should receive automatically generated reports. Separate multiple email addresses with a semicolon (;). Note: The Email notification function requires that the email settings be configured. For details, see Managing Notifications. If email notifications are enabled and no email addresses are specified, the global email settings will be used. |
|
|
Report logo |
Add your company logo to customize the report. Supported formats: JPEG, JPG, PNG, SVG (max. 1 MB). |
|
-
Click Next.
-
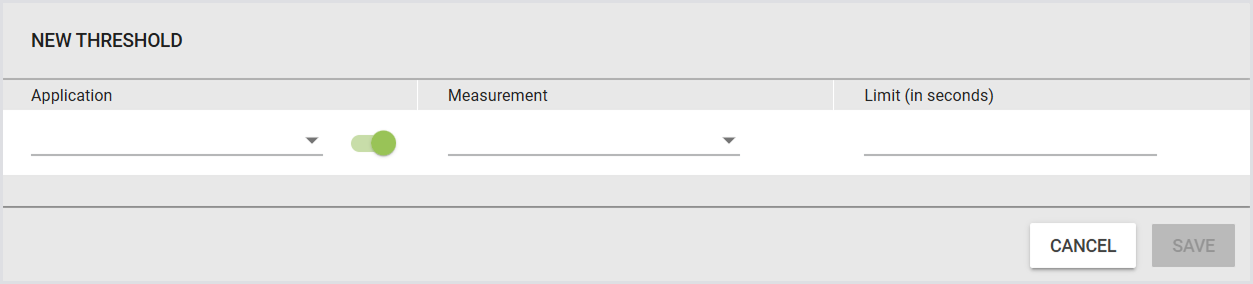
Click Add new threshold. This allows you to configure the following:
|
Application |
Measurement |
Limit (in seconds) |
|---|---|---|
|
Select the application to monitor. |
Choose the specific application measurement. |
Set the time limit for the measurement. |
Note: Any measurements that exceed this limit will be included in the SLA report.
-
Click Save to apply SLA report configurations.
Generating SLA Reports
Reports are not generated immediately unless you click Manually generate report. If the schedule is set to Daily, the first report will be available after one day. To generate a report manually, go to Available reports:
-
Click Manually generate report.
.png?cb=2c702123d6426ae0d946b568f57adbd5)
-
Select the desired date.
-
Click Generate.
.png?cb=79c9bda6900b226660db2cf094b6b4c2)
To view the report, go to Available reports and click the report you just generated. The PDF file will download automatically:

You can also download a sample SLA report from Additional Resources.
Scheduled Reports
-
Daily reports: Generated every day.
-
Weekly reports: Generated every week.
-
Monthly reports: Generated every month.
Scheduled reports can be deleted as needed.
The SLA report displays the report date, which indicates the time frame it covers.
Note: The Application Success value in the SLA Report represents the status of the entire workload script to complete successfully.

Export Data
You can export data from Continuous Tests in CSV format. This is useful for integrating data from different sources.
|
Benefit |
Explanation |
|---|---|
|
Comprehensive data analysis |
Exporting raw data allows you to perform detailed analysis and compare metrics from different tests or sources. |
|
Data integration |
Easily combine and correlate data from various tests or external systems for more robust reporting. |
|
Error tracking |
Access detailed information about application execution and performance to help troubleshoot issues. |
You can export the data using:
-
The Export Data Tab:
-
In the Continuous Testing Results page, select Export Data from the tab menu.
-
Click the green + icon to create a new export.
-
In From date and To date, specify the timeframe for exporting data, and click Next.
-
In Test selection, select environments for exporting data, and click Export.
-
In Export data, click the folder icon to download the .zip file.
-

-
The Charts Tab:
-
In the Continuous Test Results page, select Charts from the tab menu.
-
Use the drop-down menu on the left to select the configuration.
-
Click Export selected data to CSV under the chart window.
-
The RawData.zip file will be prepared and downloaded.
-

Note: The data you downloaded will also be displayed in the Export Data tab for your reference.
RawData.zip File
The RawData.zip file is named according to the following schema: RawData <TEST_NAME> <DATE> <TIME>.zip
Important: If the raw data export was generated before v6.5, and you download it, it will not contain the EUX data.
|
File Name |
Description |
|---|---|
|
AppExecutions |
Data on application script executions. Each entry represents a Virtual User starting an app and includes details on whether any errors occurred during the execution. |
|
EUX |
EUX data that you can import or export into your own data tools for reporting and analysis. |
|
Measurements |
All measurements captured during the Test Run. It covers application response times and other timers configured in the test settings. |
|
UserSessionMetrics |
CPU and Memory utilization metrics for each user session in the Test Run, expressed as percentages. |
|
UserSessions |
Information about the Virtual User accounts used during the Test Run. It details the Launcher of origin, the target host, and the logon results. |
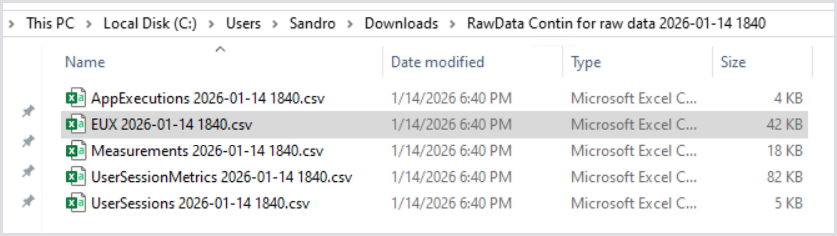
An example of the RawData.zip file looks as follows:
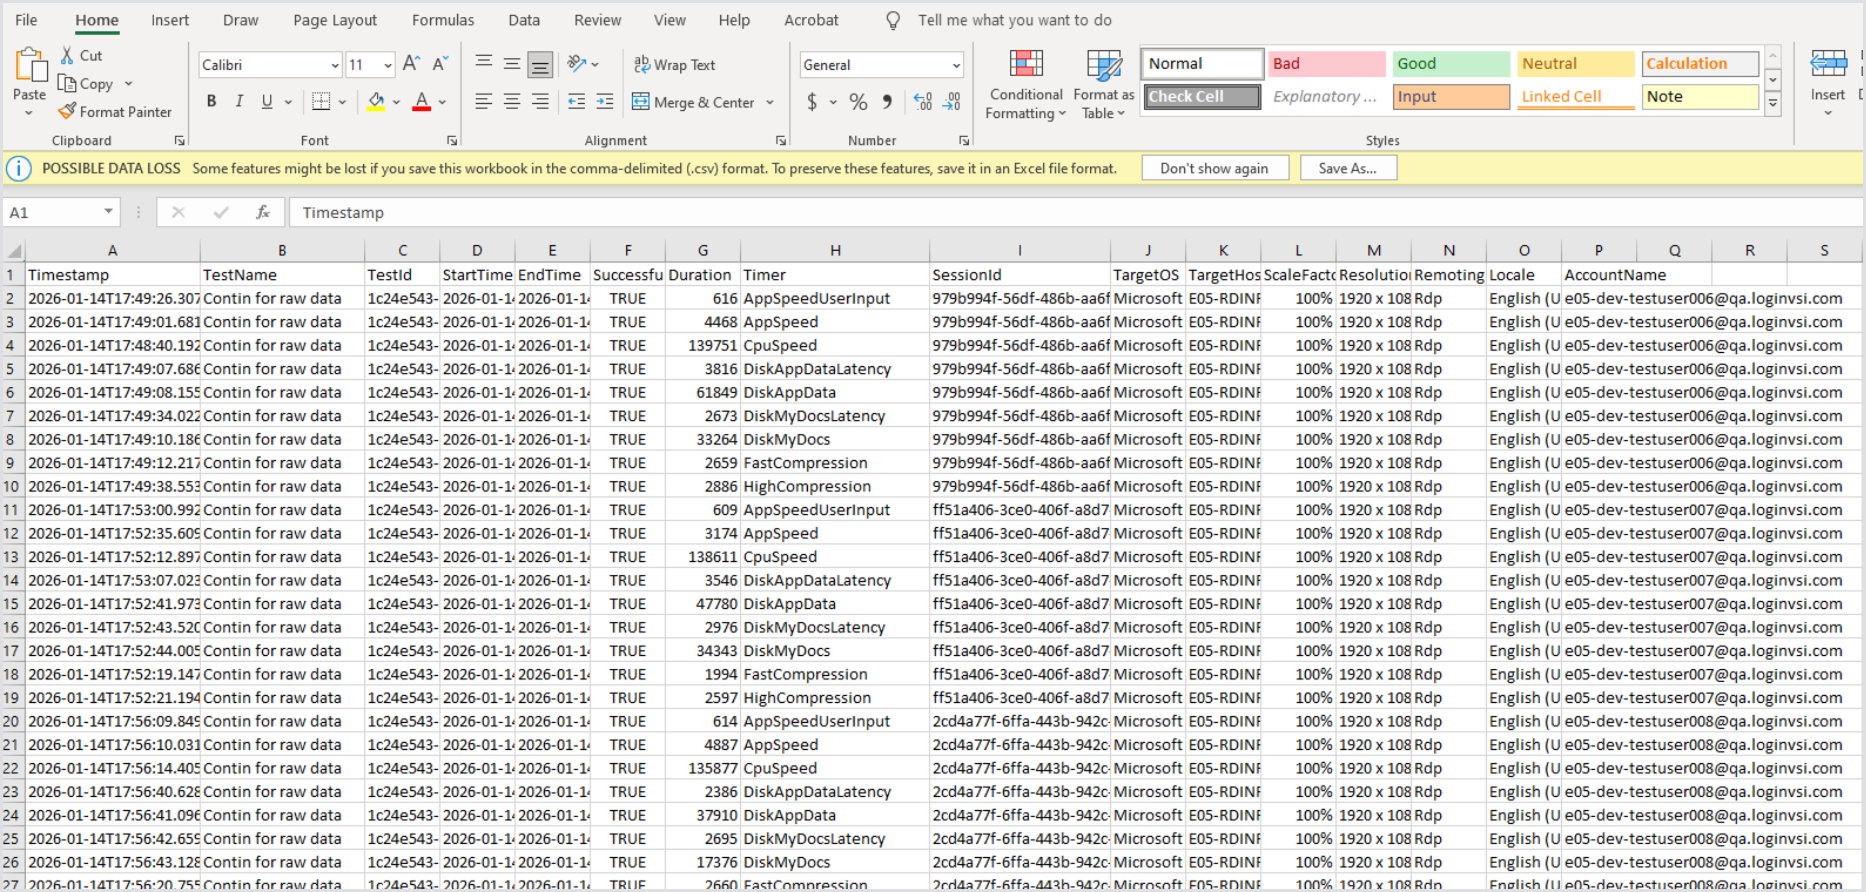
EUX Raw Data
To enhance debuggability and facilitate root-cause analysis, EUX raw timer data can be essential. Login Enterprise stores the raw data by default, and the data retention can be adjusted based on your specific needs.
Retrieving the EUX Raw Data
You can retrieve the EUX raw data via the Public API with the following request:
GET https://appliance.loginvsi.com/publicApi/v7/test-runs/{testRunId}/eux-script-executions
Tip: The testRunId is a Continuous Test Id.
The API will return all the EUX measurements for each user session. Below is an example of how the response is structured:
{
"items": [
{
"userSessionId": "6f838f90-b9ed-4e63-b04e-2291a50e34cb",
"startTime": "2025-01-06T15:20:55.288615Z",
"endTime": "2025-01-06T15:22:08.481351Z",
"successful": true,
"euxMeasurements": [
{
"timestamp": "2025-01-06T15:21:55.998094Z",
"timer": "appSpeedUserInput",
"duration": 635
},
{
"timestamp": "2025-01-06T15:21:32.025Z",
"timer": "appSpeed",
"duration": 5656
},
{
"timestamp": "2025-01-06T15:22:00.373194Z",
"timer": "cpuSpeed",
"duration": 210623
},
{
"timestamp": "2025-01-06T15:21:37.61784Z",
"timer": "diskAppDataLatency",
"duration": 4329
},
{
"timestamp": "2025-01-06T15:22:02.388249Z",
"timer": "diskAppData",
"duration": 16952
},
{
"timestamp": "2025-01-06T15:22:03.918992Z",
"timer": "diskMyDocsLatency",
"duration": 4424
},
{
"timestamp": "2025-01-06T15:22:04.419015Z",
"timer": "diskMyDocs",
"duration": 14851
},
{
"timestamp": "2025-01-06T15:21:42.172781Z",
"timer": "fastCompression",
"duration": 920
},
{
"timestamp": "2025-01-06T15:21:19.825964Z",
"timer": "highCompression",
"duration": 925
}
],
Cleaning the EUX Data (Data Retention)
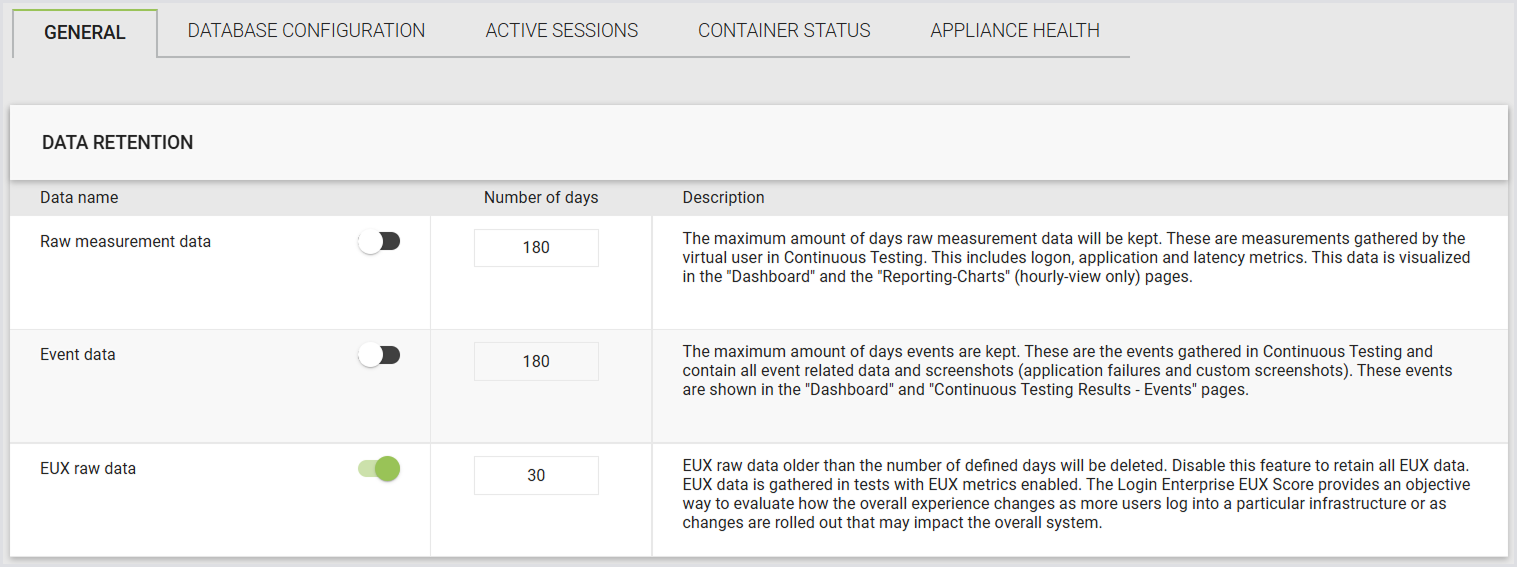
You can configure the data retention period for EUX raw data, ranging from 1 to 9999 days. Customizing this setting is crucial to managing storage resources effectively. New installations and upgrades default to a 30-day retention period, but any customizations persist through subsequent upgrades. To adjust the EUX raw data:
-
In the Login Enterprise sidebar menu, navigate to Other > System.
-
In the System, click General.
-
In Data retention, configure EUX raw data.
Tips and Tricks
Chart Legend
The chart legend provides additional statistical insights for the selected time span:
-
High: Highest value within the selected time span
-
Low: Lowest value within the selected time span
-
Average: Average value within the selected time span
-
Latest: Most recent value within the selected time span
Note: Displayed values depend on the selected aggregation. For example, the Low value may differ when using Per minute vs Per hour aggregation.

Chart Control
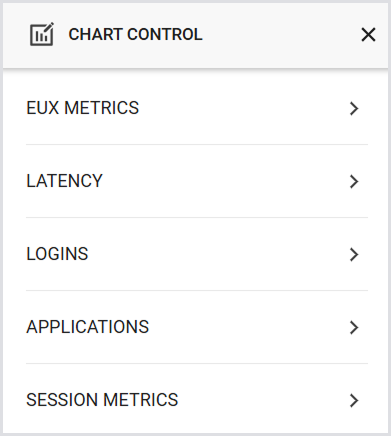
Use the Chart Control to navigate between the chart sections and select or deselect measurements.
Note: Chart Control is the same as in Load Testing Results, except the Continuous Testing Results page doesn't support side-by-side chart viewing. For details, see Chart Control.
Downloading Charts as an Image
You can download charts as images for sharing or use in custom reports and presentations. Downloading a chart as an image applies to all charts: Load Test, Continuous Test, and Appliance Health. To download a chart:
-
Locate the Download icon in the top right corner of the chart.
-
Select image format: PNG, SVG, or JPG.
-
Download the image. It will be saved to your Downloads folder, or the directory you've configured as your default Downloads location.